
V7 Go
A smarter way to manage due diligence and underwriting
Almost every list of knowledge graph use cases you will find is a bank catching fraud or a hospital matching a drug to a gene. Useful, and not your problem. A private equity firm's problem is that its most valuable information, who ran which company, which fund backed which deal, which portfolio company shares a customer with which other, sits scattered across hundreds of PDFs and spreadsheets that do not talk to each other. A management bio does not connect to a cap table. A sector report does not connect to the three portfolio companies exposed to that sector.
That disconnection is the whole problem, and it is what a knowledge graph fixes. A knowledge graph is a model of the entities a firm cares about and the relationships between them, so a question can follow the connections instead of stopping at the edge of a single document. This guide starts where the search results do, with what a knowledge graph is and the use cases it already serves across industries, and then goes where they stop: the private equity applications nobody else is writing about. For the deeper PE treatment, our companion guide on AI knowledge graphs for private equity runs alongside this one.
In this article:
What a knowledge graph is, in two minutes, and why a spreadsheet cannot do the same job.
The established use cases across finance, search, healthcare, retail, and security.
Five private equity applications, from deal sourcing to LP reporting, that the category has missed.
The architecture options, and how to get the intelligence without running the infrastructure.
What is a knowledge graph?
A knowledge graph is a structured model of real-world entities and the relationships between them. Where a spreadsheet stores facts in rows and columns, a knowledge graph stores them as connections: a company is backed by a fund, a fund is managed by a firm, an executive sits on a board. That shape lets a system traverse relationships rather than just look up values, which is the entire reason the technology exists.
The vocabulary is worth thirty seconds. The entities are nodes: people, companies, funds, deals. The relationships are edges: invested in, managed by, acquired by, sits on the board of. The most familiar example is the one in front of you every day. When you search a public company and a panel appears with its founders, subsidiaries, and competitors already linked, that is Google's Knowledge Graph doing exactly this at the scale of the open web. The enterprise version points the same idea at a firm's own data.
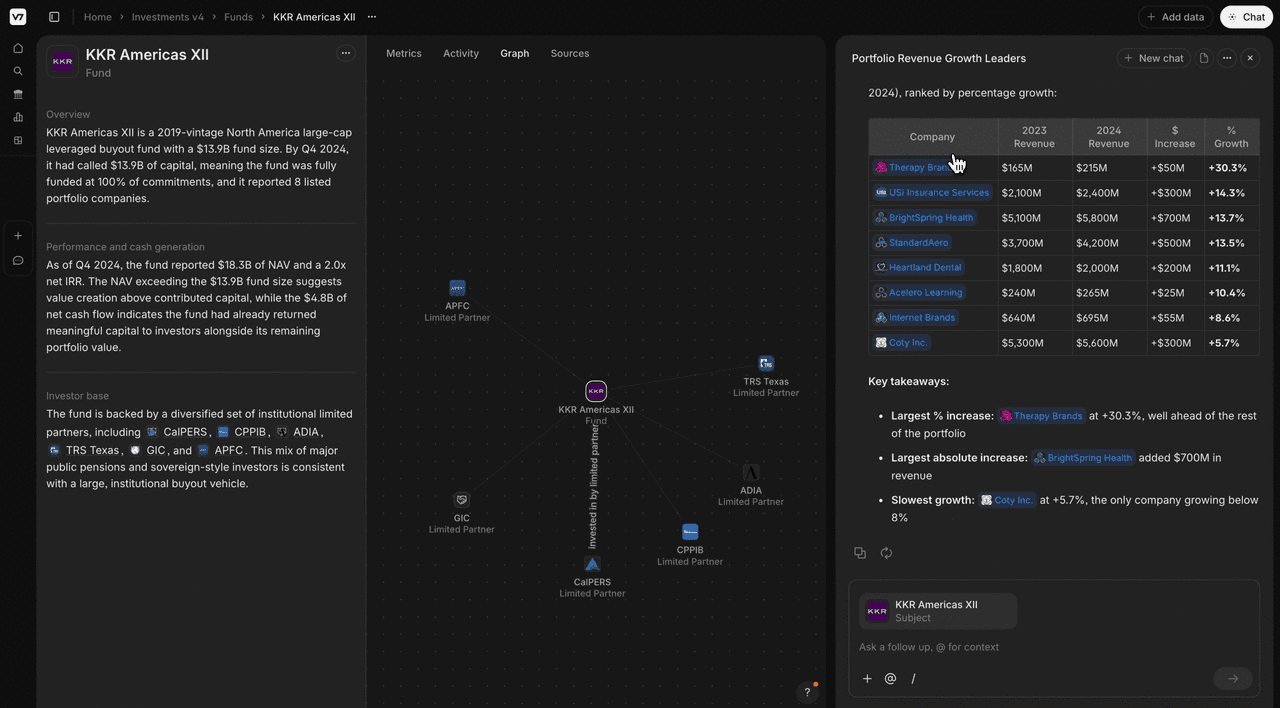
The enterprise version in practice: a question answered from the firm's own fund and portfolio data, with the underlying relationship graph visible behind the chat panel.
Why a spreadsheet or a database cannot do this
A relational database stores records in tables, and asking it a relationship question means writing joins that get slower and uglier with every hop. A spreadsheet is worse: it is a static snapshot with no memory of how anything connects. Ask either one "which of our portfolio companies share a board member with a company we passed on last year," and you are in for a manual afternoon. A knowledge graph answers by walking the connections, company to board member to company, in a single pass. The difference is not speed. It is whether the question can be asked at all.
Knowledge graph use cases across industries
Before the private equity applications, it helps to see where knowledge graphs already earn their keep. These are the use cases the category is built on, and they share one trait: the value is in the connections, not the individual records.
Financial services: fraud detection and KYC
This is the dominant finance use case, and it is a banking one, worth naming clearly before we leave it behind. Banks link transactions, accounts, identities, and ownership into a graph so a fraud ring operating under twelve names and eight accounts shows up as a single connected network. The same structure supports know-your-customer and anti-money-laundering work: tracing beneficial ownership and sanctions exposure across entities that look unrelated one record at a time.
Enterprise search and knowledge management
Semantic search is the everyday version. Instead of matching keywords, a graph-backed search understands that "deals involving this management team" is a relationship query and follows it across documents, people, and projects. For a large organisation, that turns a scattered document store into something you can actually interrogate, which is the same problem generative AI in finance keeps running into from the other direction.
Healthcare and drug discovery
Researchers connect clinical trial data, patient outcomes, drug interactions, and genetic markers into a graph, then traverse it to find a compound already approved for one condition that plausibly treats another. The relationships between the data points are the discovery. No single table holds the insight.
Retail and product intelligence
Recommendation engines are graphs. Linking products, reviews, substitutions, and customer behaviour lets a retailer explain why a customer likes something rather than just what they bought, which is what makes the next suggestion land. Amazon and the major streaming services run versions of this at enormous scale.
Cybersecurity and threat detection
Security teams link logs, assets, identities, vulnerabilities, and threat indicators, then trace an attacker's lateral movement across the network as a path through the graph. Seeing the blast radius before containment is a relationship question, and a graph is built to answer it.











Knowledge graph use cases in private equity
Here is where the category goes quiet and the opportunity opens up. Every article on knowledge graph use cases stops at banking and healthcare. None of them covers the deal team, which is odd, because private equity is about as relationship-heavy as an industry gets. Five applications carry most of the value.
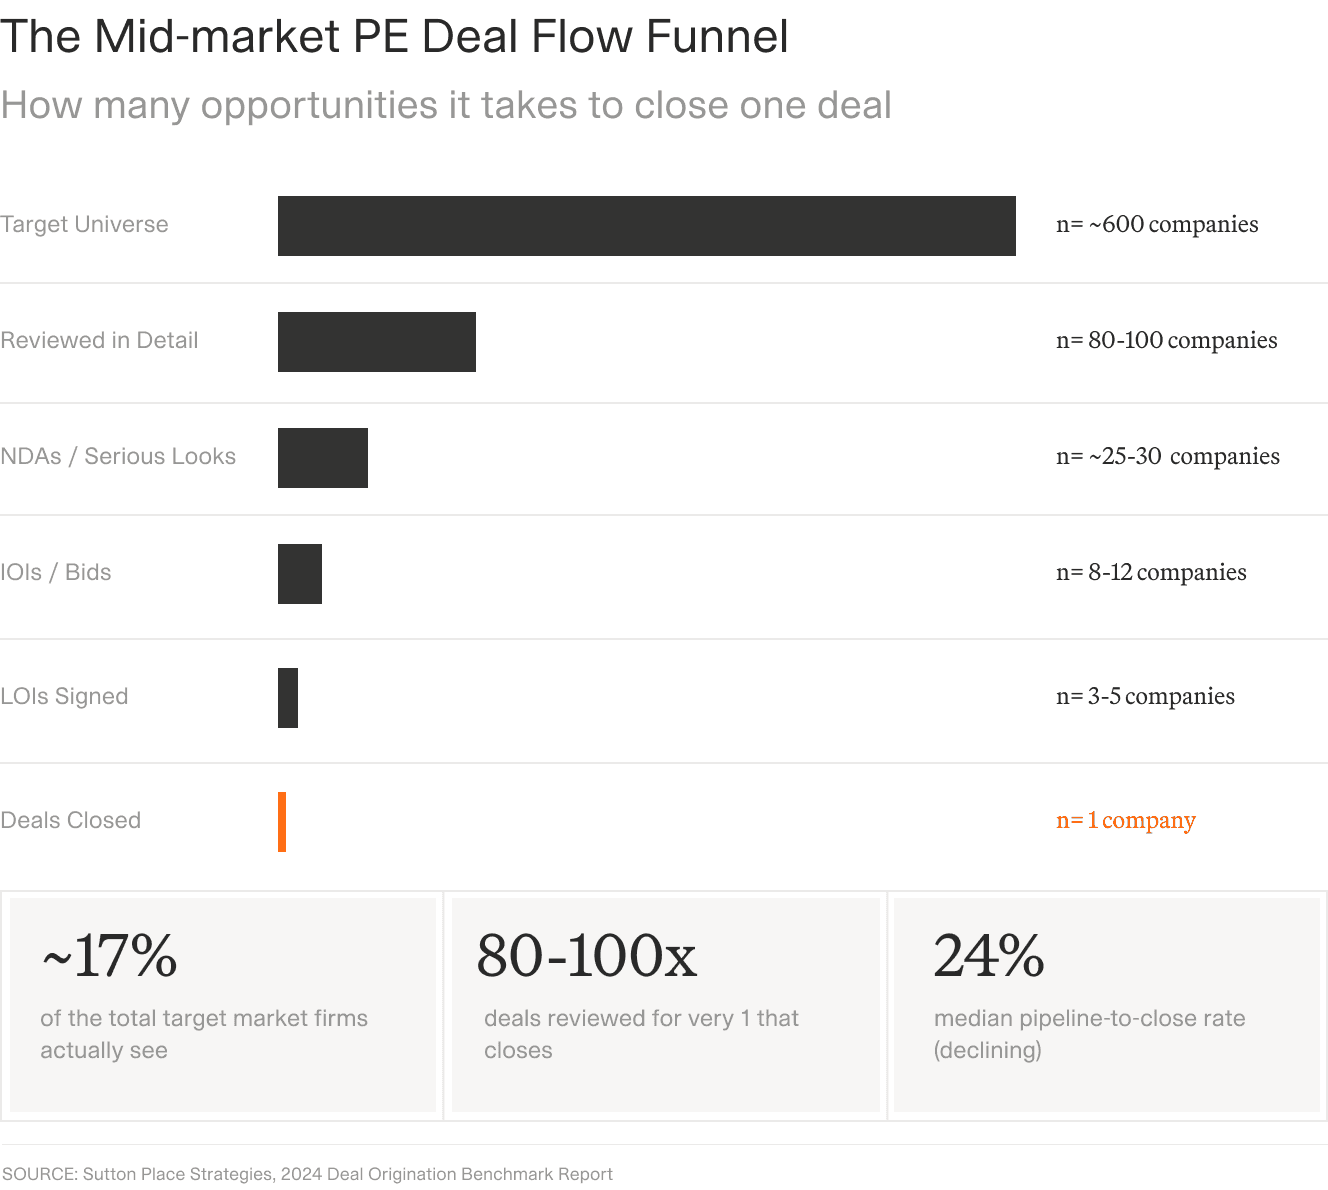
Each company in this funnel is a web of people, owners, and prior deals. A knowledge graph is what keeps that web after the deal closes or the pass is made.
1. Deal sourcing: mapping the path to a proprietary target
The best deals never reach auction. They arrive through a trusted relationship, and most firms have no systematic way to see who in their network can reach whom. A knowledge graph maps the firm's collective network as contacts and the paths between them, so a three-hop route becomes visible: a partner knows a chief financial officer who sits on the board of a company competing with a portfolio company in an adjacent market. That path is a proprietary introduction, and it is invisible in a CRM that only stores your own contacts. This is the relationship intelligence that tools like the modern private equity analysis tools are circling.
2. Due diligence: cap tables and ownership structures
A confidential information memorandum arrives with a cap table, an org chart, and dozens of documents that reference shareholders no two of which are linked. A knowledge graph pulls the entities out, shareholders, option holders, debt holders, and the relationships between them, ownership percentage, preference position, vesting, into one structure you can traverse. Circular ownership, hidden related parties, and preference-stack anomalies become visible in a way a spreadsheet will never surface. Our guide to private equity fund due diligence covers where these traps usually hide.
3. Portfolio monitoring: performance across a network
Portfolio company data lives in quarterly updates, monthly management accounts, and board decks, all disconnected. A knowledge graph links each company to its KPIs, management, sector, supply chain, and debt, so a change anywhere in the network surfaces where it matters. When a portfolio company's largest customer, worth 40% of its revenue, starts showing distress in the news, the exposure surfaces on its own instead of in a post-mortem. That is the shift that makes portfolio monitoring continuous rather than quarterly.
4. Sector mapping: competitive intelligence as a network
A firm tracks dozens of companies in each target sector, and the relationships between them, shared customers, common suppliers, co-investors, management crossover, matter as much as any single metric. Mapped as a graph, two companies with overlapping customers and non-competing products read as an obvious consolidation play. In a spreadsheet, they are two rows that never meet.
5. LP reporting: from static numbers to relationship-aware narratives
Limited-partner reports get assembled by hand every quarter from portfolio updates, fund-level rollups, and benchmark comparisons. A knowledge graph links those layers, so a report can trace why a number moved rather than just restate it. The manual assembly that eats a multi-day cycle becomes a question the data can answer directly.
Knowledge graph types, and which one fits a fund
There is more than one way to hold a knowledge graph, and the choice mostly comes down to how much infrastructure you want to own. Two architectures dominate the technical literature, and a third option matters more to a fund than either.
Property graphs
Property graphs, the model behind Neo4j, TigerGraph, and similar systems, attach attributes to typed, directional edges. They are strong for transactional relationship queries at scale, which is why bank fraud teams use them. They also assume a graph database, a schema, and the engineers to run all of it. That is a fit for a firm with a fifty-person data team, not a fund with fifteen deal professionals.
RDF graphs
RDF (Resource Description Framework) stores facts as subject-predicate-object triples and is the standard behind the semantic web. It is rigorous and built for interoperability, which makes it the choice of regulators and academic institutions and the wrong starting point for almost every PE firm. The implementation overhead buys formality most deal teams will never use.
The practical option: don't build a graph, use one
The third option is not a different kind of graph. It is not building one. Rather than standing up a database and populating it, a fund can adopt a platform whose job is to hold the firm's knowledge and answer relationship questions over the documents it already has. The property-graph and RDF routes are the build-it-yourself paths. This is the buy-a-working-memory path, and for most funds it is the only one that survives contact with a real calendar. It is where V7 Context Graph fits, and the next section is about what that actually buys you.
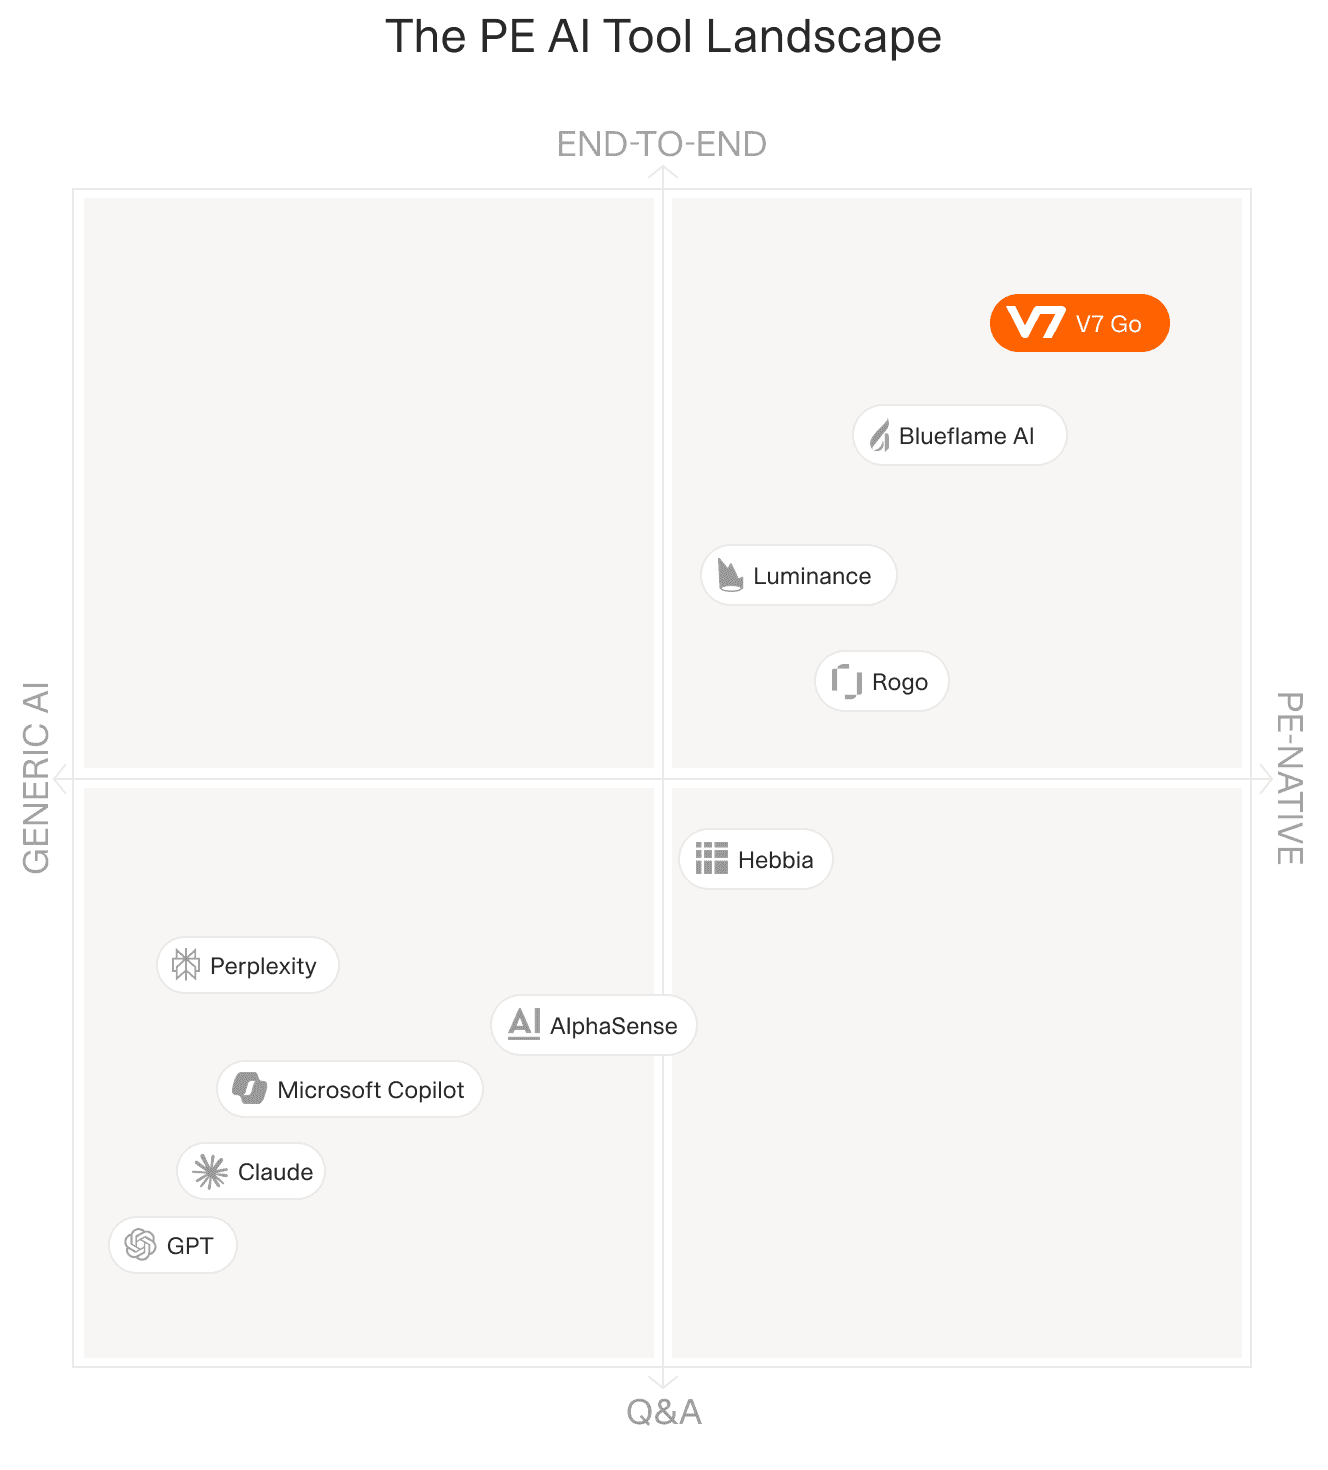
The build-versus-buy choice is really a question of what you want to own: graph infrastructure, or answers over the documents you already have.
GraphRAG, and what it means for a PE analyst
GraphRAG is the reason this stopped being a database topic and became an AI one. Graph retrieval-augmented generation (GraphRAG) is a way of answering questions that follows relationships before it answers, rather than just fetching text that looks similar to the query. For a language model working on a firm's documents, that is the difference between a plausible guess and a grounded answer with a path behind it.
It matters for private equity because the questions that matter are multi-hop. Ask a standard model "which of our portfolio companies are exposed to this regulatory change, and who on those management teams has handled something similar before," and it will produce fluent nonsense, because the answer is spread across documents and named in none of them. Relationship-aware answering traces the chain instead. This is a live research direction, not a vendor slogan: Microsoft Research published the foundational GraphRAG work and its method paper, and independent studies on financial data have measured fewer hallucinations when retrieval respects relationships. If the underlying idea of retrieval is new to you, our explainer on what RAG is sets it up.
A relationship-aware question walks the connections between funds, companies, and people rather than searching for text that mentions them.
Getting there: build the infrastructure, or use a memory that already works
Strip away the architecture debate and a fund faces one decision: assemble and maintain the machinery yourself, or adopt a platform whose job is to be your firm's memory. Both are legitimate. Only one is realistic for most teams.
The build route means a graph database, an ontology, a pipeline from your documents, and the engineers to keep all of it fed as new deals arrive. It is a program measured in quarters, it delivers nothing until it is finished, and the upkeep never stops. For a large firm with a data team and a multi-year roadmap it can pay off. For most funds it stalls, because the firm wanted answers, not another system to operate.
V7 Context Graph is the other route: the firm's memory, built from the documents you already have. Worth being precise about the label: knowledge graph is the general category this whole article has covered; Context Graph is V7's specific product, its own implementation of that category, built for private equity data rather than as a generic graph database a fund has to run itself. Every company evaluated, every deal considered, every general-partner relationship, held in one place and queryable in plain language, with each answer traceable to the exact sentence or cell it came from so a figure can survive an investment committee. It treats the same company, named three ways across a memorandum, a filing, and a portfolio report, as one company, so a question draws on everything the firm knows. The advantage it creates is not a clever query a competitor can copy in a weekend. It is your firm's own accumulated context, which no one else has, growing sharper with every document it sees. For the deal-workflow side of this, V7's AI due diligence agent and the wider virtual data room workflows plug into the same memory.
How V7 Go handles finance workflows, from DDQ completion to CIM extraction, with every answer traceable to its source and held in the firm's Context Graph.
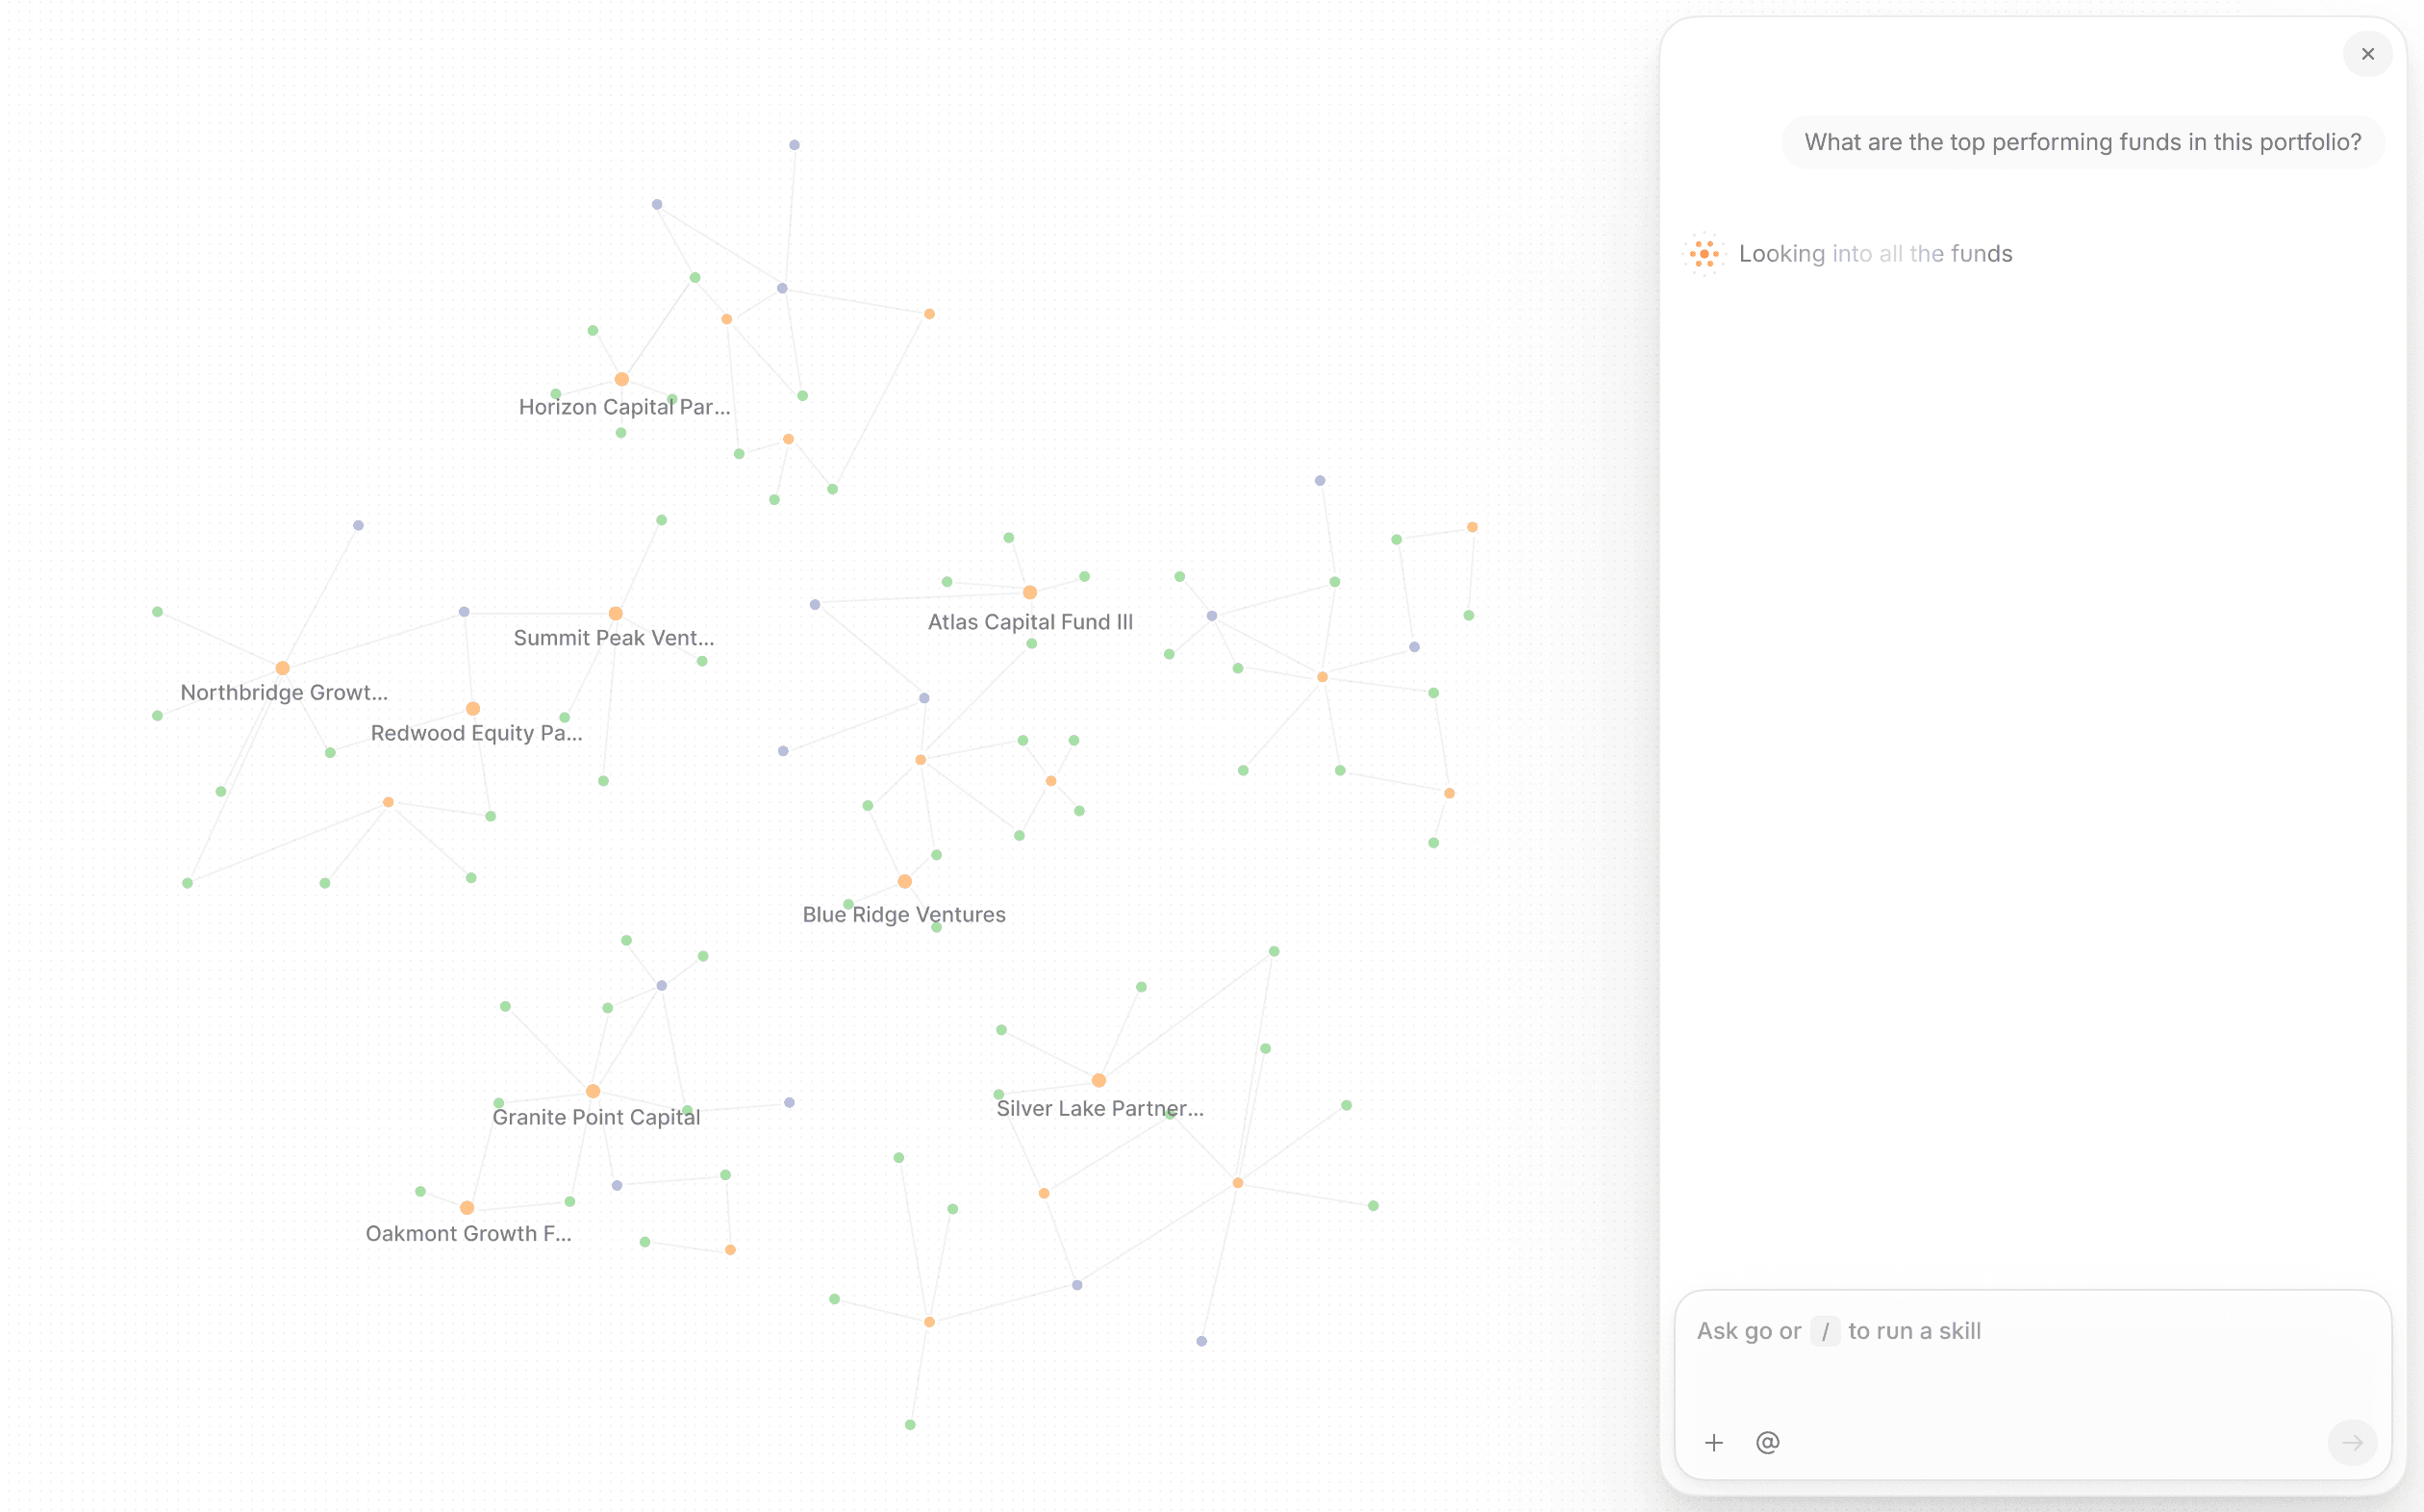
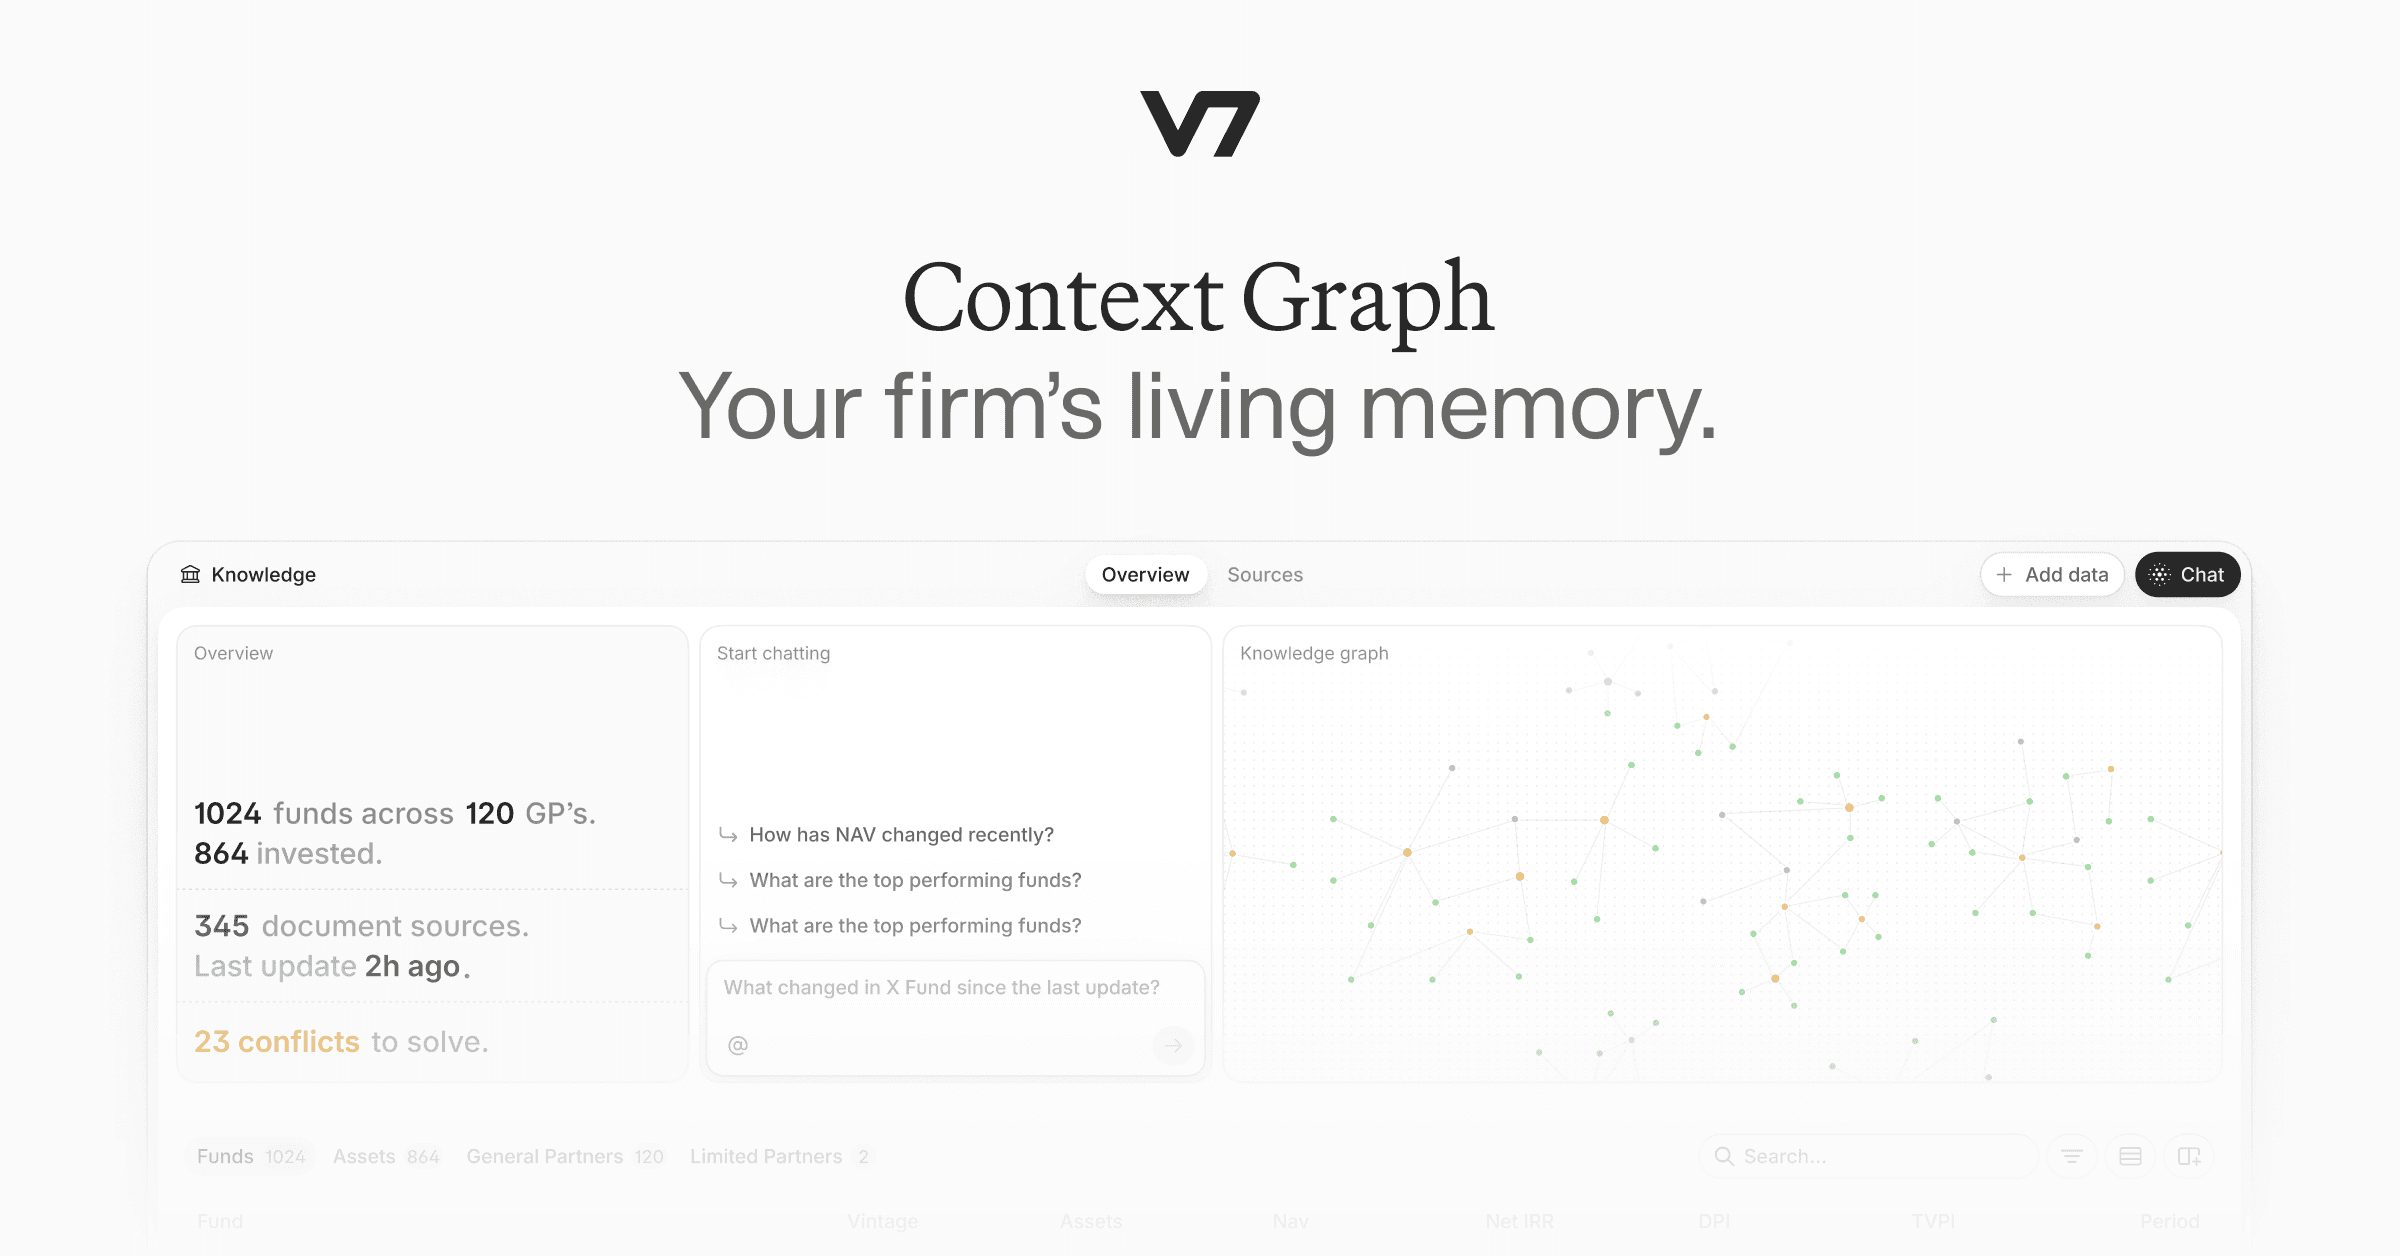
Context Graph in use: the firm's funds, companies, and relationships in one place, answering across everything it has seen rather than a single document.
The knowledge graph use cases that get written about, fraud rings and drug interactions, are real, but they are someone else's. The ones that matter to a fund are the quiet ones: the introduction path nobody mapped, the ownership anomaly nobody caught, the customer concentration nobody connected until it was a write-down.
None of that requires a data-engineering project. It requires a decision to stop letting the firm's knowledge live in inboxes and individual heads, and to put it somewhere the whole team can reach. Start with the workflow that costs you most, whether that is sourcing, diligence, or the reporting cycle, and let the memory grow from there.
If you want to see what your own firm's context graph would look like against your real deal history, V7 runs a working session built around your data. That is the next step, and it takes about the length of a partner meeting.
What is a knowledge graph in simple terms?
A knowledge graph is a digital model that maps entities, such as people, companies, deals, and funds, and the relationships between them. Unlike a spreadsheet, which stores facts in rows and columns, a knowledge graph stores facts as connections, for example that one company is backed by a particular fund, or that an executive sits on a specific board. That structure lets a system traverse relationships rather than just look up individual values, which is why it can answer questions a traditional database struggles with. In practice, it turns a pile of disconnected documents into something you can ask relationship questions of: who is connected to whom, through what, and how far apart. The familiar public example is the panel of linked facts that appears when you search a company or a person online.
+
What are the most common knowledge graph use cases?
The established use cases sit in a handful of industries. In banking, knowledge graphs map transactions, accounts, and ownership to expose fraud rings and support know-your-customer checks. In enterprise search, they power semantic retrieval across scattered documents and systems. In healthcare, they connect clinical data, drug interactions, and genetic markers to support research and discovery. In retail, they drive recommendation engines that understand why a customer likes something. In cybersecurity, they trace an attacker's path across a network. In private equity, a newer and largely unclaimed set of use cases is emerging: deal sourcing through relationship mapping, due diligence on cap tables and ownership structures, portfolio monitoring across a network of companies, sector mapping, and limited-partner reporting.
+
How can private equity firms use knowledge graphs?
Private equity firms apply knowledge graph intelligence to five core workflows. First, deal sourcing: mapping the firm's network to find introduction paths to proprietary targets before they reach auction. Second, due diligence: structuring cap table and ownership relationships so circular structures, hidden related parties, and preference-stack anomalies become visible. Third, portfolio monitoring: linking each portfolio company to its KPIs, sector, and supply chain so exposure surfaces as it develops rather than after the fact. Fourth, sector mapping: modelling competitive dynamics as a network to spot consolidation opportunities. Fifth, limited-partner reporting: connecting portfolio performance to fund-level narratives so a report can trace why a number moved instead of just restating it. The common thread is that relationships stop living in individual heads and become something the whole firm can query.
+
What is GraphRAG and how does it relate to knowledge graphs?
GraphRAG, short for graph retrieval-augmented generation, is an approach to answering questions that combines a knowledge graph with a language model. Standard retrieval fetches text that resembles the query; GraphRAG follows relationships across the graph before it answers, which lets it handle multi-hop questions that span several connected entities. For a private equity firm, that is the difference between a model guessing at a deal history and one that traces the chain from portfolio company to sector to management team and returns an answer grounded in the underlying documents. The approach is an active research direction, with foundational work from Microsoft Research and independent studies on financial data showing fewer hallucinations when retrieval respects relationships rather than surface similarity. It is best understood as the bridge between the structure of a knowledge graph and the language ability of a model.
+
Can private equity firms use knowledge graphs without a data-engineering team?
A private equity knowledge graph draws on the documents a firm already generates, most of them unstructured. That includes confidential information memoranda, management presentations, due diligence reports, cap tables, board decks, fund documents, limited-partner agreements, and external market reports. The entities it resolves from those sources include portfolio companies, management team members, co-investors, counterparties, sectors, and geographies. The relationships include investment history, board positions, commercial contracts, prior exits, and limited-partner commitments. The value grows with coverage: a graph built on a decade of deal history answers questions that one built on last quarter's pipeline cannot, which is why the emphasis is on capturing the firm's accumulated knowledge rather than any single document type. Resolving the same entity across many documents is what lets one question draw on everything the firm knows about it.
+
What data goes into a private equity knowledge graph?
Go is more accurate and robust than calling a model provider directly. By breaking down complex tasks into reasoning steps with Index Knowledge, Go enables LLMs to query your data more accurately than an out of the box API call. Combining this with conditional logic, which can route high sensitivity data to a human review, Go builds robustness into your AI powered workflows.
+
Casimir is a seasoned tech journalist and content creator specializing in AI implementation and new technologies. His expertise lies in LLM orchestration, chatbots, generative AI applications, and computer vision.