16 min read
—



V7 Go
A smarter way to manage due diligence and underwriting
A private equity firm's real edge is not its spreadsheet. It is knowing that the CFO of the manufacturer you are about to pass on ran finance at a business your fund exited in 2019, that two of your portfolio companies already share the same logistics provider, and that a co-investor you trust looked at this exact deal eighteen months ago and walked. That knowledge exists inside your firm. It is just scattered across inboxes, data rooms, and the heads of people who might leave next quarter. A knowledge graph is what turns that scattered memory into something you can actually query.
Knowledge graphs in private equity have moved from a data-science curiosity to something deal teams ask about by name. The reason is structural. A spreadsheet stores values in cells. A knowledge graph stores the relationships between them. That sounds academic until you try to answer "who in our network can introduce us to this management team?" with a CRM export and a Friday afternoon.
Most of the writing on this topic is about banks. It covers fraud detection, know-your-customer checks, and credit risk, and none of it maps to how a deal team actually works. A fund does not review 400 counterparties for money laundering. It reviews 400 companies a year, passes on 98% of them, and needs to remember why. The questions a private equity knowledge graph has to answer are about people, ownership, prior deals, and sector history, not transaction anomalies.
This guide is written for the person who owns that problem: the VP or Director of investment operations who manages the analysts, the data, and the reporting cycle. If you already understand the pain, you can skip the definitions and go straight to the five use cases. If you want to know what sits underneath a modern knowledge graph, the section on GraphRAG covers the architecture without assuming you run a data-science team. For broader context on where this fits, our overview of AI for private equity and venture capital is a useful companion.
In this article:
What a knowledge graph is, and why private equity data breaks the tools most firms use.
Five ways private equity firms use knowledge graphs, from deal sourcing to exit.
GraphRAG: the architecture that connects a knowledge graph to a language model.
The two ways to build one, and how to get graph intelligence without a data-engineering project.
What a knowledge graph is, and why private equity data is different
A knowledge graph is a structured map of entities and the relationships between them. In private equity, the entities are companies, management teams, funds, deals, sectors, and capital structures. The relationships are the part that matters: who owns what, who ran which business, which fund invested alongside which co-investor, and which advisor sat on both sides of a prior transaction.
Hold that definition against a traditional database and the difference gets concrete. A database can tell you that Company A has 50 million dollars in revenue. A knowledge graph can tell you that Company A's chief executive previously ran a business your firm passed on in 2021, that its largest customer is also a supplier to one of your portfolio companies, and that the sell-side advisor ran the last three processes in the same sub-sector. The database stores a fact. The graph stores the web the fact lives in.
Private equity is unusually badly served by the row-and-column model, for two reasons. The first is that the industry runs on relationships, and relationships are edges, not cells. The second is that almost none of the source data arrives structured. A confidential information memorandum is a 200-page PDF. A cap table is an Excel file built by someone who has since left the company. Board minutes are Word documents. The financials are in a data room that gets taken down after close. The information a deal team needs is real, but it lives in formats a spreadsheet cannot connect.
At a single deal, a sharp analyst holds most of this in their head. At fund scale, nobody can. A firm running 50 portfolio companies and reviewing 400 opportunities a year is tracking thousands of entities and tens of thousands of relationships between them. The map is too big for memory and too connected for a spreadsheet. This is the point where knowledge graphs stop being theoretical and start being infrastructure. For a sense of scale, Bain's Global Private Equity Report tracks just how much deal and portfolio data the average fund now sits on, and how little of it is queryable.
The spreadsheet trap: why most firms manage knowledge the hard way
Most firms manage institutional knowledge in spreadsheets and shared drives, and it fails them in a specific, predictable way. A spreadsheet captures values. It cannot capture that the CFO in row 12 previously worked at the company in row 340, which missed a covenant in Q3. The relationship is the valuable part, and it is exactly the part the format throws away.
The cost compounds quietly. Every new hire relearns the firm's relationship map from scratch, usually by asking a partner over coffee. Every departing partner takes a decade of context with them, and it does not come back. The reporting burden is the visible symptom: analysts spend the majority of a reporting cycle collecting and normalising data by hand rather than analysing it. But the deeper loss is the pattern nobody sees, because seeing it would require holding the whole map at once. That is the job a graph does and a grid cannot. It is also why portfolio monitoring stays manual at most firms long after everything else has been automated.
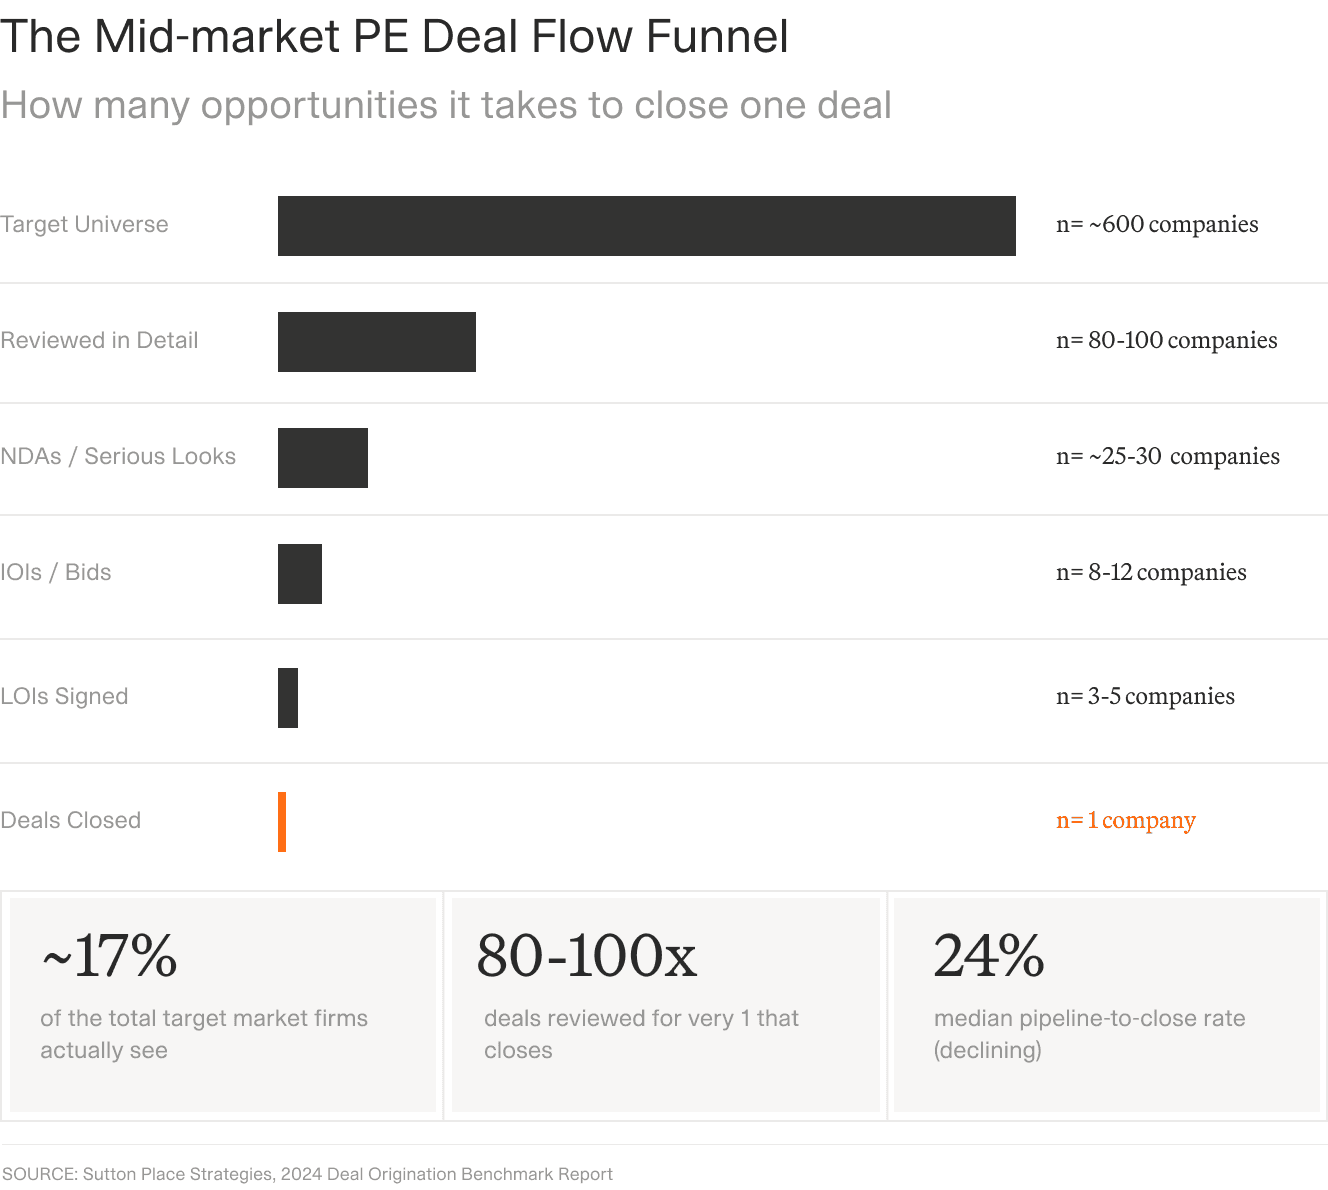
Every company in this funnel generates documents, relationships, and a pass-or-proceed decision. Without a knowledge layer, the 99 you passed on leave nothing behind for the next deal.
Five ways private equity firms use knowledge graphs
The abstract case for knowledge graphs is easy to nod along to and hard to act on. The concrete case is five workflows a deal team already runs, each of which gets materially better when relationships become queryable. None of these requires you to think of your data as a graph. They just require the connections to be there when you ask.
1. Deal sourcing: mapping the path to an off-market target
Off-market deals are won on relationship paths, not lists. The question is never "which companies exist in this sector." It is "who do we already know who can get us a warm introduction to this specific management team." A knowledge graph answers that by connecting your portfolio executives, co-investors, advisors, and former operators into a network you can traverse.
Here is the shape of it. A target's founder sat on the board of a company your fund owned four years ago. A CRM lookup will not surface that, because the CRM stores your contacts, not the second-degree links between them. The graph surfaces it because a board seat is an edge, and traversing edges is the entire point. Multiply that across a decade of deals and the difference between "we have no way in" and "we are one introduction away" is often a query, not a cold email.
2. Due diligence: multi-hop network analysis
Diligence is where multi-hop reasoning earns its keep. A multi-hop query traverses several relationships to answer one question: A owns B, which supplies C, whose founder previously ran D. A spreadsheet can hold the relationships someone thought to disclose. A graph surfaces the ones nobody did, by connecting filings, news, and document data into a single traversable structure.
In practice this looks like tracing a holding-company structure to its beneficial owners, checking whether any of them appear in regulatory filings, and mapping supplier concentration three hops out from the target. It is the difference between diligence that confirms what the seller told you and diligence that finds what the seller did not. Our guide to private equity fund due diligence goes deeper on where these gaps usually hide, and V7's AI due diligence agent runs the document side of the same workflow.
Consider one worked example. The target sells through three regional distributors, all disclosed. The graph connects those distributors to their other customers and shows that two of them also carry the target's largest competitor, which nobody disclosed and which changes how you read the revenue. That is a single query. Reconstructing it by hand means pulling three distributor filings, cross-referencing customer lists, and hoping an analyst thinks to check. Diligence timelines rarely leave room for the manual version, which is why that kind of relationship usually surfaces after close, when it is expensive.
3. Portfolio monitoring: cross-portfolio pattern recognition
At fund scale, your portfolio companies are not independent. They share customers, suppliers, competitors, and sometimes executives, and those shared edges are where fund-level risk lives. A knowledge graph makes the overlap visible. Three portfolio companies depend on the same logistics provider, and a disruption at that provider stops being three separate incidents and becomes one concentrated exposure you can act on before it hits.
The same structure supports benchmarking that actually compares like with like: management-team composition, pricing strategy, and customer concentration across companies that share a sector or a stage. This is the reporting work that consumes analyst time today, and it is consumed precisely because the relationships have to be reconstructed by hand every quarter.
The number makes it concrete. When a new portfolio company reports 45-day receivables, the figure means nothing on its own. Set against the six companies in your portfolio that share its sector and revenue band, it means the company runs about a week slower than its closest comparables, which is a working-capital conversation for month one rather than year one. That comparison is trivial once the relationships exist and close to impossible to assemble by hand every reporting cycle.
4. Market and sector mapping: tracking the ecosystem
A sector thesis is a set of relationships over time: which management teams have scaled companies in adjacent verticals, which acquirers keep showing up, which co-investors cluster around a particular idea. A knowledge graph pulls news, filings, and internal notes into one model of the ecosystem, so a thesis is something you can interrogate rather than something that lives in a partner's memory and a stale deck.
A concrete version: a firm building a thesis around logistics software can ask which operators have scaled a comparable business, where those operators are now, and which of the firm's existing relationships reach them. The answer is a shortlist of named people with a path to each, not a market map that needs a week of desk research to refresh.
The practical payoff is continuity. When the partner who owns a sector view is travelling, or gone, the map does not travel with them. The next analyst inherits a queryable model instead of a folder of PDFs and a vague sense that "we've looked at this space before."
5. Exit and fundraising: the relationship path to the right buyer
Exit planning is a sourcing problem run in reverse. The question is which strategic acquirers, sponsors, or public-market analysts already have a relationship with the management team or a track record in the sector. A knowledge graph turns that into a ranked set of paths rather than a brainstorm. Fundraising works the same way: mapping which limited partners have backed your co-investors' funds tells you where the warm introductions for your next raise actually are.
None of these five use cases is exotic. They are the core of the job. What changes is that the relationships stop living in individual heads and start living somewhere the whole firm can reach.











GraphRAG: the architecture under a modern knowledge graph
The technology that makes a knowledge graph useful to a deal team, rather than to a data scientist, has a name: GraphRAG. It is the combination of a knowledge graph, which holds the relationship structure, and retrieval-augmented generation, which lets a language model reason over documents. Neither half is enough alone. A graph can trace relationships but cannot read the nuance in a 200-page memorandum. A language model can read the memorandum but cannot hold the relationships across hundreds of documents at once.
Standard retrieval-augmented generation has a specific blind spot for private equity work. It searches for text that resembles your query, so asking "which of our advisors has worked with teams that sold to strategic buyers in healthcare" tends to fail, because the answer is spread across many documents and no single passage contains it. The system retrieves tokens, not relationships. If you are new to this mechanism, our explainer on what RAG is and IBM's overview of retrieval-augmented generation both cover it well.
GraphRAG closes that gap by letting the model traverse the graph and the document content together, which is what makes multi-hop questions answerable. This is not a fringe idea. Microsoft Research published the canonical GraphRAG work and the underlying method paper, and the graph-database vendors have followed with their own GraphRAG implementations. The technique is established. The question for a fund is not whether it works, but whether building it is worth the engineering.
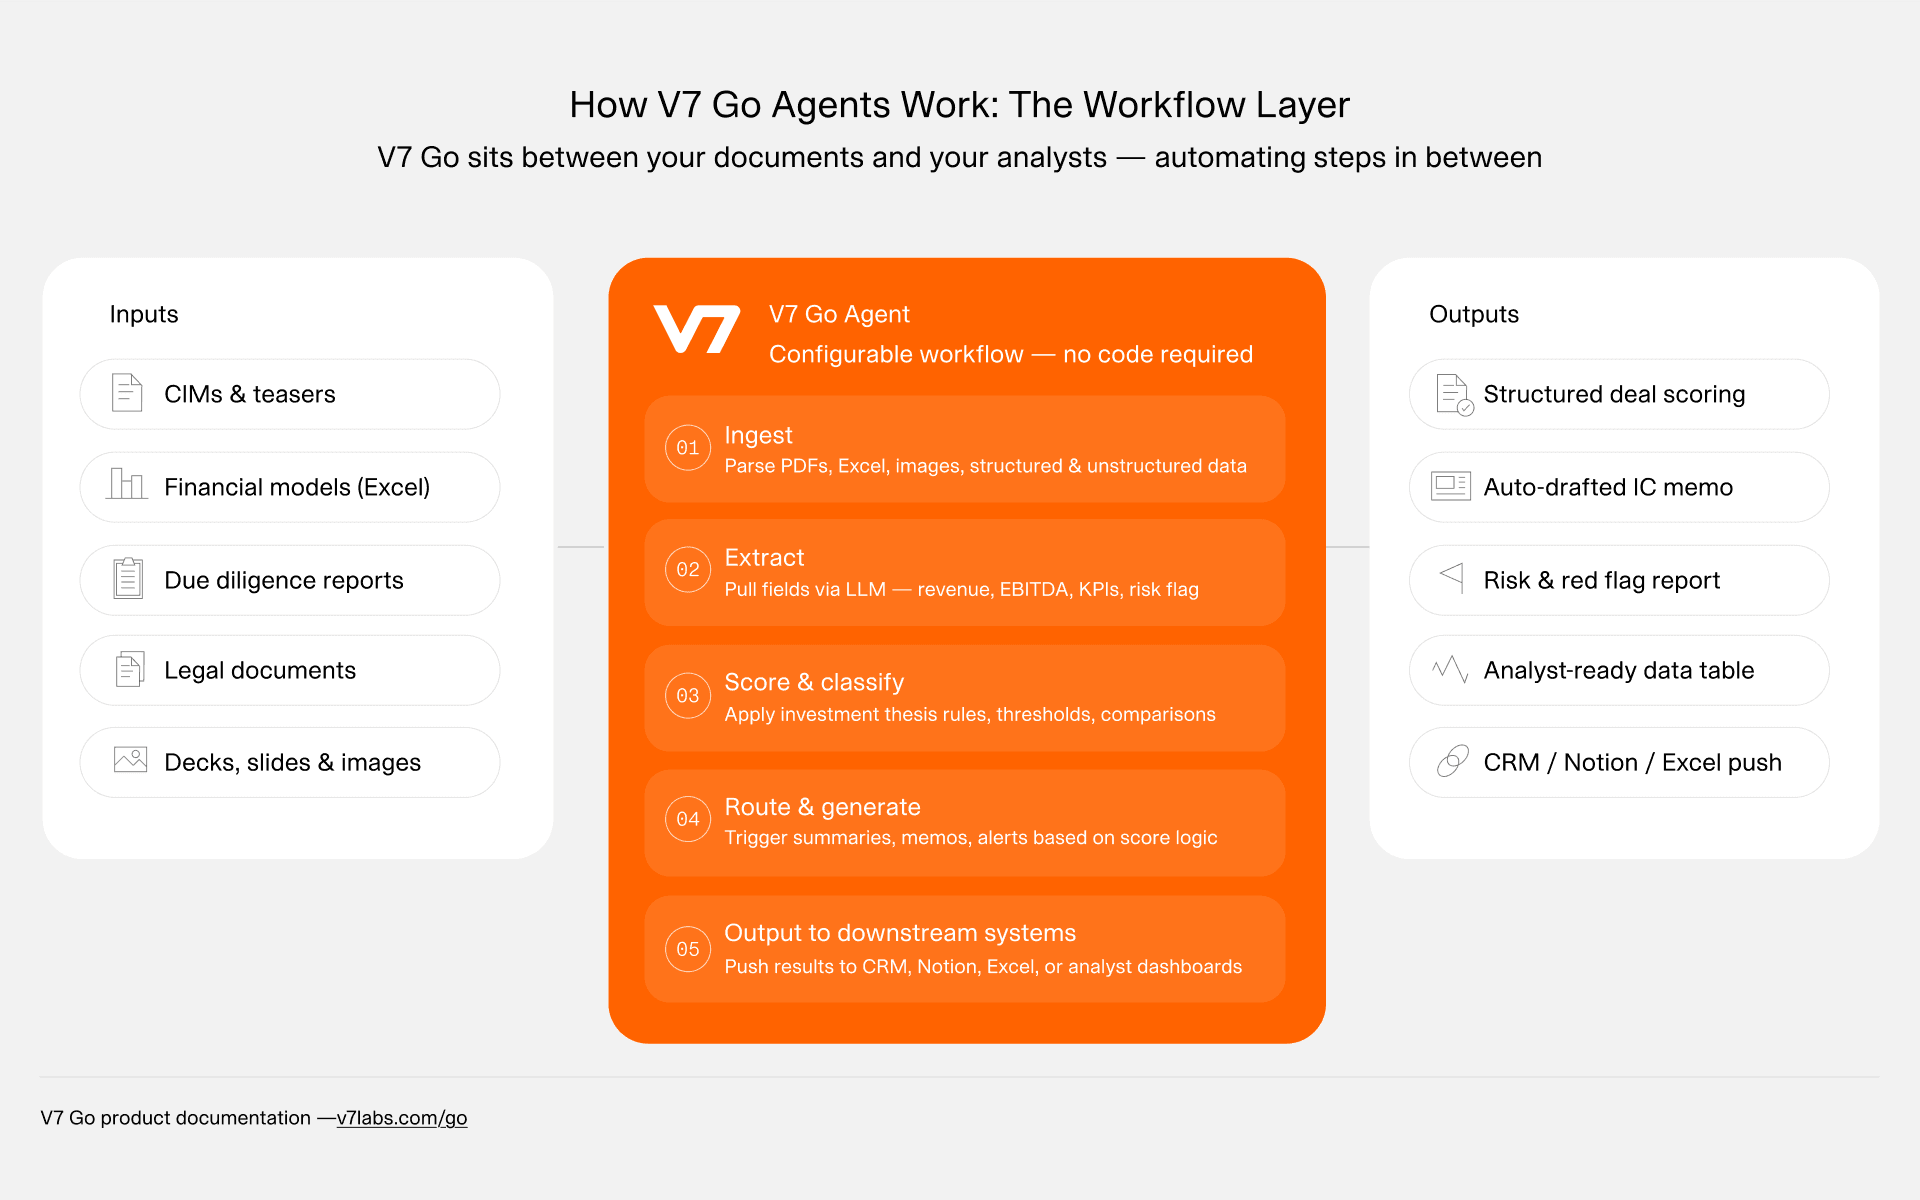
A knowledge graph is only as good as what feeds it. The value comes from the pipeline that turns raw deal documents into resolved entities and relationships, not from the graph sitting empty.
Two ways to build a private equity knowledge graph
There are two honest paths to a working knowledge graph, and they suit different firms. Pretending there is only one is how these projects stall.
Path one: infrastructure first
The first path builds a graph database directly. You stand up a Neo4j, Amazon Neptune, or TigerGraph instance, design an ontology that defines your node and edge types, and build a pipeline that extracts entities and relationships from your documents to populate it. Firms sometimes anchor the schema to the Financial Industry Business Ontology so the definitions are standard rather than bespoke.
Done well, this is powerful and fully custom. It is also a data-engineering project measured in quarters, not weeks, and it needs graph engineers you probably do not have on staff. It makes sense for a tier-one firm with a dedicated data-science team and a mandate to build proprietary infrastructure. For most funds, the ontology design alone outlasts the enthusiasm that started it.
Path two: document-indexed knowledge
The second path skips the graph database and indexes the documents themselves in a structure-aware knowledge layer. Instead of extracting every relationship into edges ahead of time, queries resolve relationships by traversing the connections between indexed documents. For the large majority of private equity questions, that is functionally equivalent, and it works with the formats you already have: PDF memoranda, Excel cap tables, PowerPoint decks, and the contents of a virtual data room.
The trade-off is real and worth stating plainly. A document-indexed approach is less flexible for highly custom graph queries than a purpose-built graph database. What you give up in edge-case flexibility you get back in time-to-value: days instead of quarters, and no graph engineers required. For a firm whose goal is answers rather than infrastructure, that is usually the right trade.
How V7 Context Graph gives deal teams graph intelligence without the engineering
V7 Context Graph is the document-indexed path, built for firms that want the relationship intelligence without standing up a graph database. It is a persistent, entity-resolved knowledge layer built on your own data: every company evaluated, every deal considered, every general-partner relationship documented, connected and queryable in plain language. Most AI knows everything about the world and nothing about your firm. This is the part that fixes the second half.
Worth being precise about the terms here, since the industry uses them loosely. A knowledge graph is the general concept this article has been building up: entities and the relationships between them, however they end up stored. Context Graph is V7's own product, a specific implementation of that concept built around private equity data rather than a generic graph database a firm has to configure and feed itself.
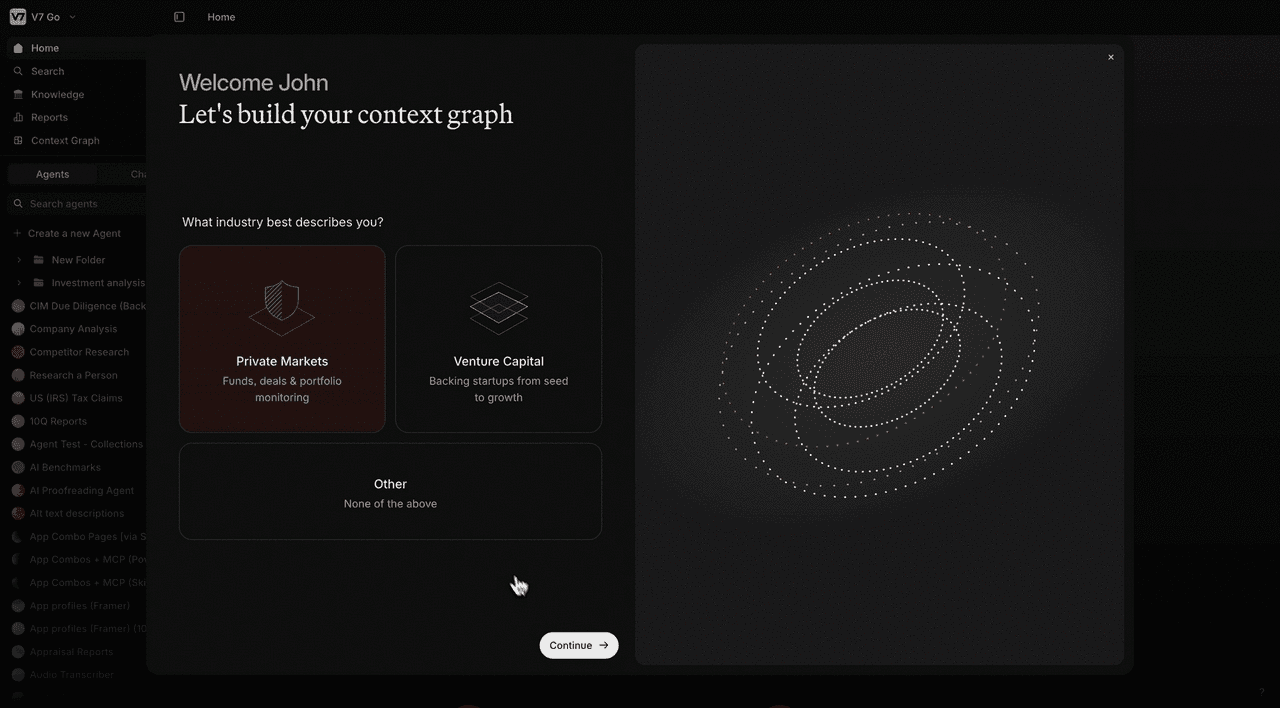
Setting one up starts here: point it at an industry and the firm's own documents. The relationship intelligence comes from what gets fed in after this screen, not from a data-engineering project beforehand.
The mechanism matters, because it is what separates this from a chatbot pointed at a folder. When a new memorandum arrives, the screening agent does not start from a blank prompt. It queries the Context Graph first, and surfaces the firm's prior view of the sector, any portfolio overlap, and the reason the team passed last time. The knowledge that used to walk out the door with a departing analyst stays in the firm. Every document processed makes the next screen faster.
Entity resolution is the unglamorous part that makes the rest work. The same company appears as a slightly different name in a memorandum, a filing, and a portfolio report, and a naive system treats those as three companies. Context Graph resolves them to one, which is what lets a question about a single business pull from every document that touches it. Skip that step and a knowledge graph is just a search box with better styling.
Two details make this credible for regulated work. First, every extraction traces back to its exact source: a citation opens to the sentence in a PDF or the cell in a spreadsheet it came from, which is non-negotiable when an investment committee memo has to be defensible. Second, the output is not a file. Context Graph is the operational layer where the team reviews, questions, and acts on the data. Structured results can flow onward to a CRM, a database, or an existing system through an API or connector, but the working environment is the platform itself, not an exported spreadsheet.
The workflow it replaces is familiar. A memorandum lands, an agent extracts the entities and figures, the Context Graph resolves them against everything the firm already knows, and an analyst asks questions across the whole pipeline in natural language. What was four hours of cross-referencing becomes a query. For a fuller comparison of where this sits against point tools, our roundup of private equity analysis tools is a good next read.
The short version of the finance workflow is easier to watch than to describe.

A walkthrough of how V7 Go handles finance workflows, from DDQ completion to CIM extraction, with every answer traceable to its source and fed back into the firm's Context Graph.
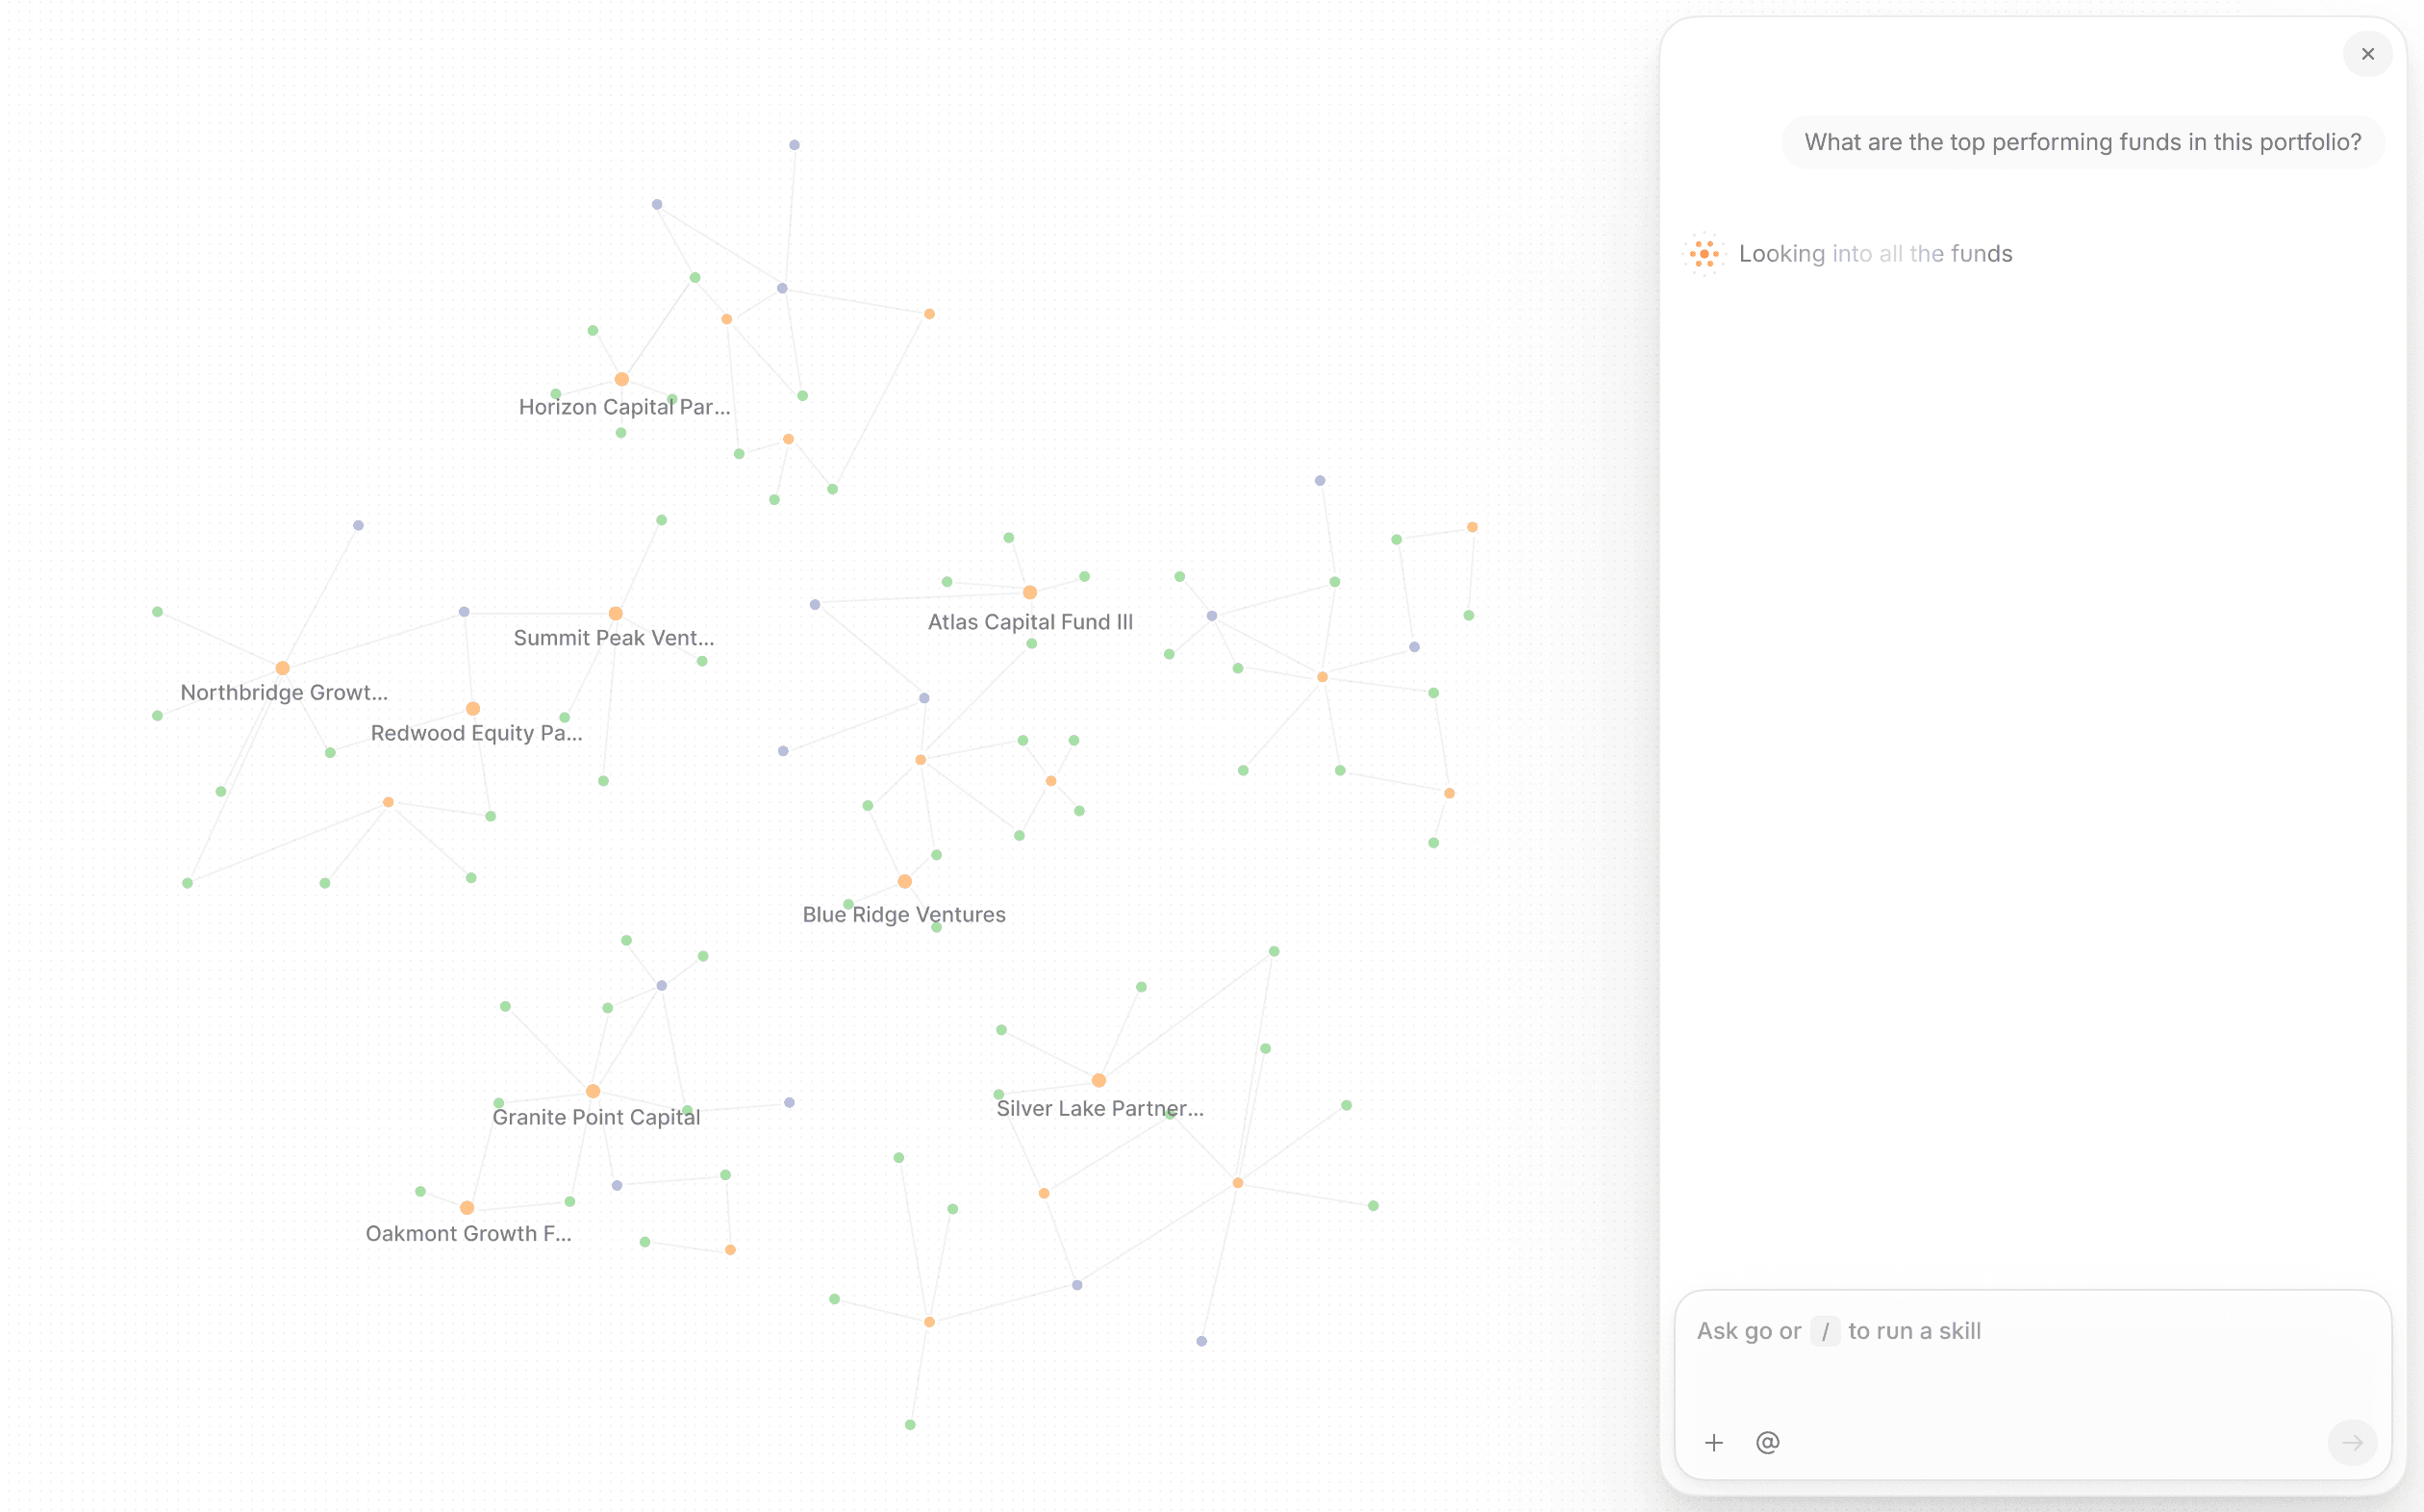
The Context Graph interface: a queryable map of funds, general partners, and sources on the left, natural-language questions in the middle, and the resolved entity graph on the right. The relationships are the product.
If you take one thing from all of this, make it the reframing. The question is not whether your firm should build a knowledge graph. It is whether your firm's memory should keep living in inboxes and individual heads, or somewhere the whole team can reach.
The firms that get this right do not treat it as a technology project. They treat it as the decision to stop losing institutional knowledge every time an analyst leaves and every time a deal closes and the data room comes down. The graph is just the form that decision takes. Start with the workflow that hurts most, whether that is screening, diligence, or the reporting cycle, and let the knowledge layer grow from there.
If you want to see what your own firm's context graph would look like against your real deal history, V7 runs a working session built around your use case. That is the concrete next step: not a demo of features, but your data, mapped.
What is a knowledge graph in private equity?
A knowledge graph in private equity is a structured map of the entities a firm cares about, such as companies, management teams, funds, deals, and sectors, along with the relationships between them. Where a spreadsheet stores values in cells, a knowledge graph stores connections: who owns what, who ran which business, and which co-investors have worked together. That distinction matters because private equity decisions turn on relationships rather than isolated facts. A database can tell you a company's revenue. A knowledge graph can tell you that its chief executive previously ran a business your fund passed on, and that its largest customer supplies one of your portfolio companies. It differs from a CRM, which stores contact records and activity logs, by modelling the whole investment ecosystem and making those relationships queryable at scale.
+
How do private equity firms use knowledge graphs?
Private equity firms use knowledge graphs across the deal lifecycle. In sourcing, they map relationship paths to off-market targets, finding who in the firm's network can make a warm introduction to a specific management team. In due diligence, they run multi-hop queries that trace ownership chains and supplier concentration several relationships out from the target. In portfolio monitoring, they surface shared customers, suppliers, and executives across companies, so a disruption at a common vendor is caught as one concentrated risk rather than three separate incidents. In market mapping, they track how management teams, acquirers, and co-investors move through a sector over time. In exit and fundraising, they identify which buyers or limited partners already have a relationship with the team or the sector. The common thread is that relationships become queryable instead of living in individual memory.
+
What is GraphRAG and why does it matter for investment research?
GraphRAG combines a knowledge graph with retrieval-augmented generation. The knowledge graph holds the relationship structure between entities, and retrieval-augmented generation lets a language model reason over the underlying documents. It matters for investment research because standard retrieval searches for text that resembles a query, which fails on questions whose answer is spread across many documents and named in none of them. A question like which advisors have worked with teams that sold to strategic buyers in a given sector requires connecting information, not matching keywords. GraphRAG lets the model traverse the graph and the document content together, so multi-hop questions become answerable. The approach is well established: Microsoft Research published the canonical work, an academic method paper documents it, and graph-database vendors have shipped their own implementations. For a private equity team, it is the architecture that makes a knowledge graph useful without a data-science team to operate it.
+
How is a knowledge graph different from a traditional database or spreadsheet?
A traditional database or spreadsheet stores facts in rows and columns. A knowledge graph stores the relationships between those facts. The practical difference shows up the moment you ask a relational question. A spreadsheet can tell you that a portfolio company had a given revenue figure last quarter. It cannot tell you that the same company's chief financial officer previously worked at another company in your portfolio that missed a covenant, because a cell holds a value and not a connection. Knowledge graphs represent entities as nodes and relationships as edges, which means questions that traverse several connections at once become answerable. For private equity specifically, where the valuable information is almost always relational, this is the difference between a record of what you already know and a map that surfaces what you did not realise you knew.
+
Can a private equity firm build a knowledge graph without a data-engineering team?
A private equity knowledge graph connects the documents and records a firm already generates, most of which arrive unstructured. That includes confidential information memoranda, data-room contents, cap tables, financial statements, portfolio reports, investment committee memos, and limited-partner agreements, alongside external sources such as news and regulatory filings. The point of the graph is to resolve the entities across all of these into a single model, so that a company mentioned in a memorandum, named in a filing, and tracked in a portfolio report is understood to be the same company. Once the entities are resolved, the relationships between them become queryable: shared executives, common suppliers, prior deals, and co-investment history. The value is proportional to coverage. A graph built on a decade of deal history answers questions that a graph built on last quarter's pipeline cannot, which is why the institutional-memory framing matters more than any single document type.
+
What data does a private equity knowledge graph connect?
Go is more accurate and robust than calling a model provider directly. By breaking down complex tasks into reasoning steps with Index Knowledge, Go enables LLMs to query your data more accurately than an out of the box API call. Combining this with conditional logic, which can route high sensitivity data to a human review, Go builds robustness into your AI powered workflows.
+
Casimir is a seasoned tech journalist and content creator specializing in AI implementation and new technologies. His expertise lies in LLM orchestration, chatbots, generative AI applications, and computer vision.