Knowledge work automation
17 min read
—


Private equity firms spend an extraordinary amount of time on two phases of the investment cycle: finding and buying companies. The deal team, the operating partners, the IC process, the external advisers, and the legal documentation. All of this infrastructure is built for the entry. Exit preparation gets its own sprint of attention in the twelve to eighteen months before a sale process begins.
The three to five years between close and exit receive a different level of attention. Board meetings happen quarterly. Management accounts arrive monthly but get read on a lag. The investment base case, which was stress-tested by the IC before approval, sits in a data room while the real business deviates from it in small ways that compound over time. The value creation plan that the IC reviewed before approval becomes a reference document rather than a monitoring tool.
This is not because PE professionals do not care about portfolio companies. It is because monitoring is structurally under-resourced relative to the returns it can protect. A 2025 McKinsey study of more than 100 PE funds with vintages after 2020 found that general partners focusing on operational value creation achieve two to three percentage points higher IRR on average than peers who do not, per McKinsey's Global Private Markets Report. Revenue growth now accounts for 71% of value created at exit, according to Blue Ridge Partners' analysis of 2024 PE exits, up from 64% in 2023. Multiple expansion, which carried buyout returns through the prior decade, has contracted as a lever. The margin improvement that could close the gap between average and top-quartile returns is built in the holding period, not at entry or exit. Most of it depends on whether monitoring catches the drift before it becomes a problem.
Why the monitoring period is structurally under-resourced relative to deal sourcing and exit preparation
The three places where portfolio value erodes silently: base case drift, reporting lag, and plan execution gaps
What financial statement spreading is and why it is the foundation of effective monitoring
How the J-curve changes the monitoring obligation, especially in years one and two post-close
How AI document tools are changing the economics of portfolio monitoring at scale

AI for document processing
Catch portfolio value erosion before it compounds
Get started today
Why portfolio monitoring is systematically under-resourced
The economics of a private equity firm are organized around deals. Deal professionals are paid most of their variable compensation based on the performance of the investments they source and close. The carry structure rewards realized gains, which depend on entry quality and exit timing more than on what happens in the middle. And the visible outputs that define a PE professional's reputation (the CIM review, the IC memo, the negotiation) are all concentrated at the deal stages.
This creates an incentive structure that pulls attention toward transactions and away from monitoring. A deal professional who sources and closes two investments in a year has produced something observable and attributable. The same professional who spends equivalent time monitoring existing portfolio companies has produced something much harder to quantify: problems caught early, covenant headroom preserved, operating leverage captured before the budget cycle closed. The value is real. The attribution is invisible.
The result is that most PE firms monitor portfolio companies with a staffing ratio that would not pass the same scrutiny as their deal team. A firm managing a portfolio of fifteen companies across three funds may have two or three operating partners responsible for active engagement with management teams, alongside deal professionals who maintain board roles while also working on new deals. The management accounts that arrive each month from each company enter a queue that competes with live transaction work for the same people's attention.
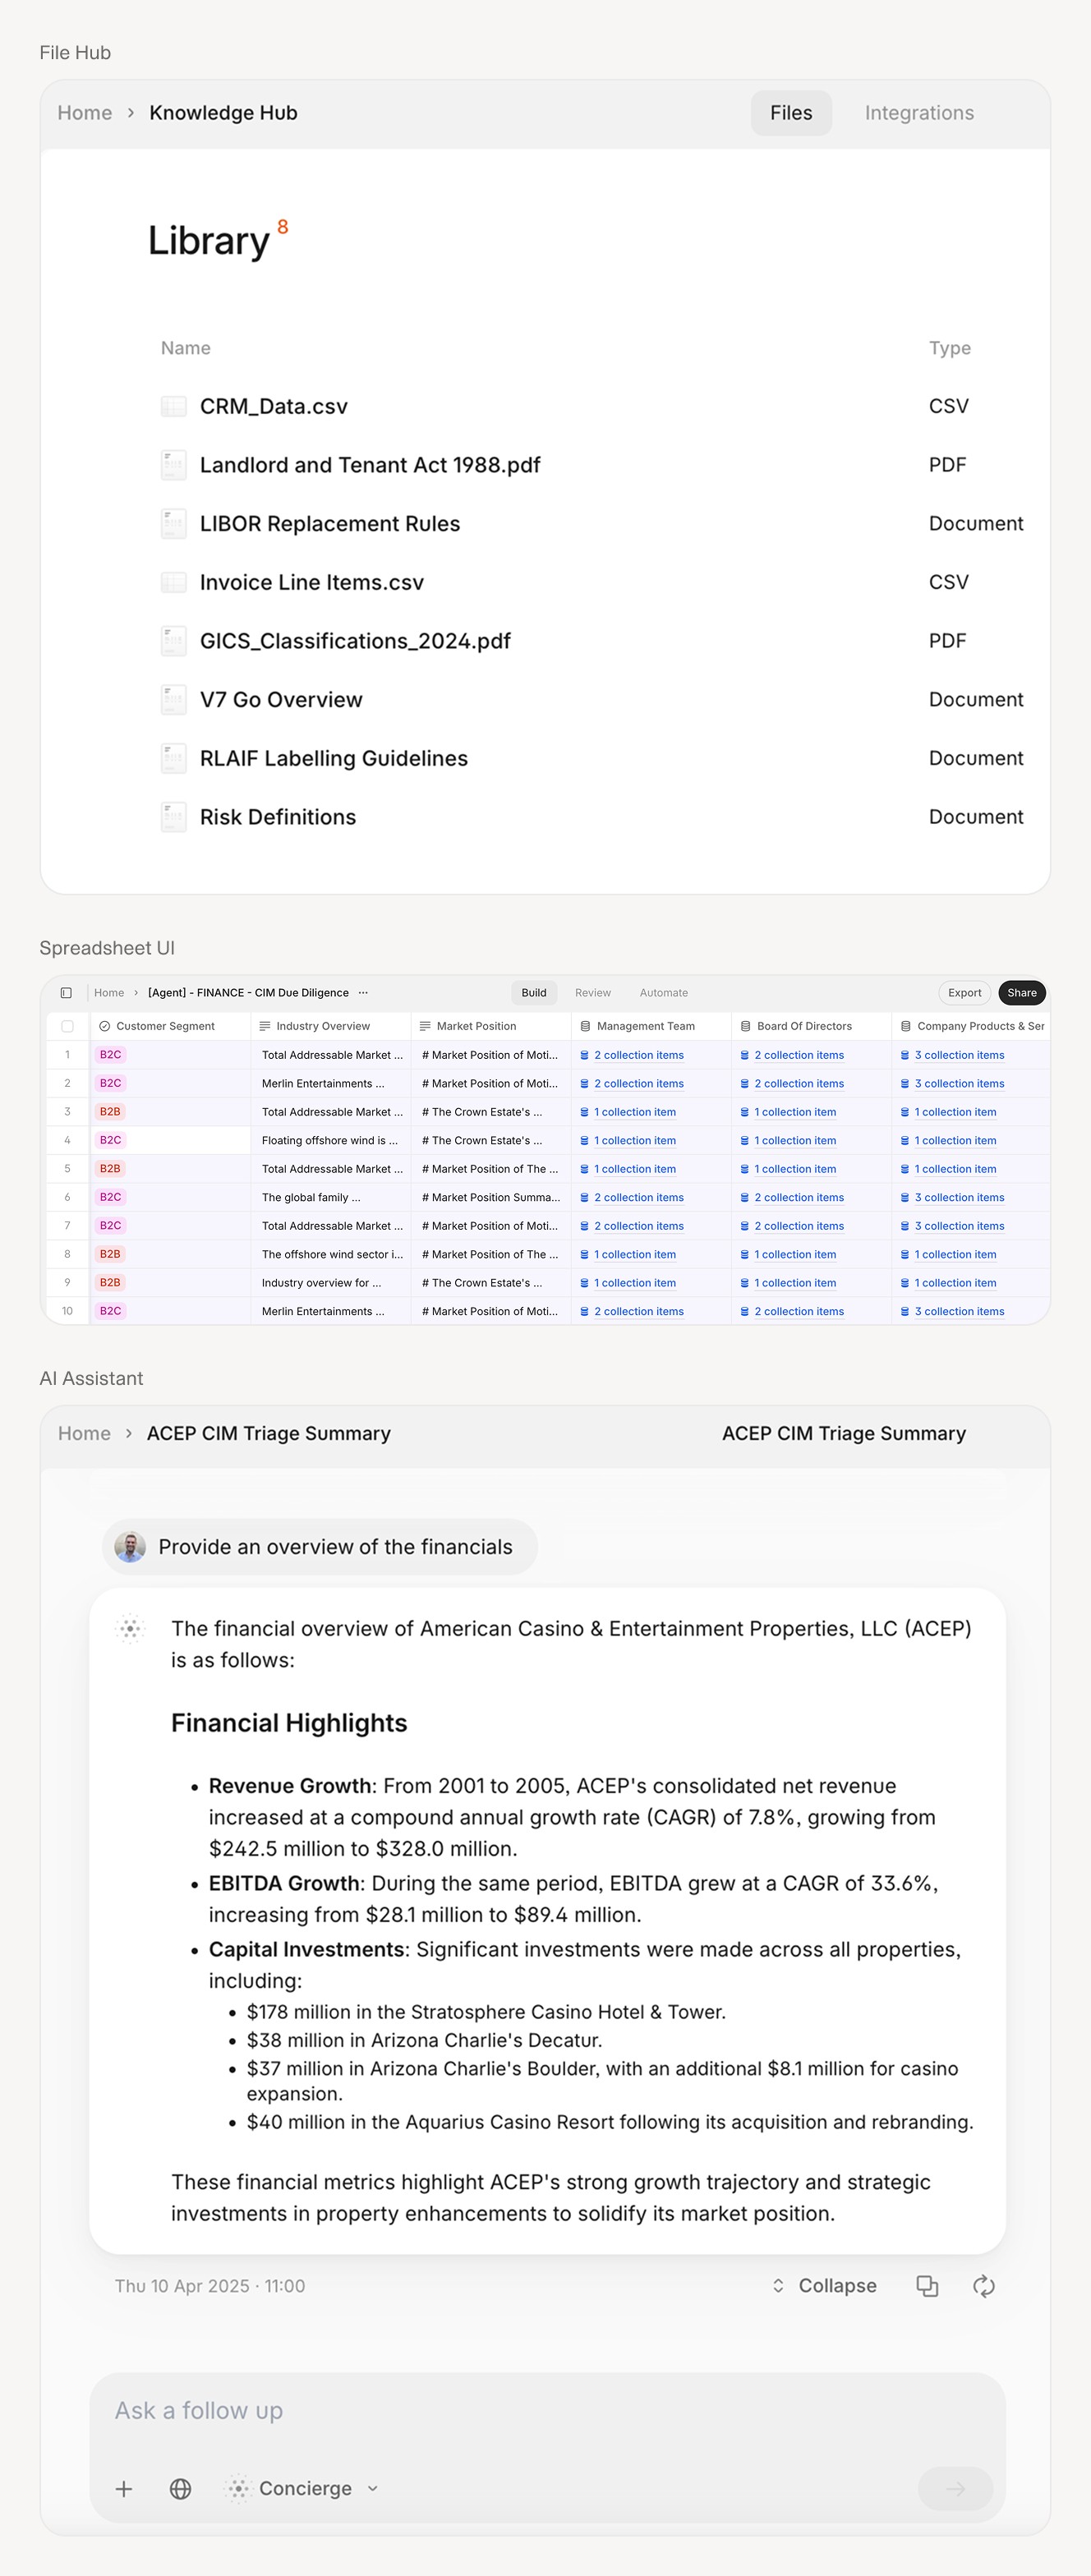
AI document tools applied to management accounts and monthly reporting packages can surface KPI deviations before a board meeting, compressing the information lag that defines most PE portfolio monitoring cycles.
The J-curve and the monitoring obligation it creates
The J-curve describes the typical pattern of private equity fund returns: negative or flat in the early years as capital is deployed and management fees are charged against a fund NAV that reflects unrealized investments, followed by a recovery as portfolio companies mature and exits generate distributions. The curve is a structural feature of private equity investing, not a sign of poor performance, and experienced LPs expect it.
What the J-curve also means is that the first two to three years of a portfolio company's ownership are the period when returns are most vulnerable to deterioration and least visible to LPs. A company that is underperforming its investment base case in year two is not yet reflected in realized distributions. Its NAV contribution to the fund depends on how conservatively or aggressively the GP marks the position. The GP's quarterly reporting to LPs describes performance against the investment thesis in language chosen to maintain LP confidence. The underlying problem may not surface until a refinancing event, a missed earn-out payment, or a management team change brings it into view.
The monitoring obligation is highest precisely when visibility is lowest. Year one and year two post-close are when integration actions need to execute, when the value creation plan milestones are first tested, and when the business is often most exposed to the assumptions that the IC accepted. This is also when deal professionals are most likely to be working on new transactions, and when operating partner attention is distributed across the broadest number of companies in active post-close phases simultaneously.
The three places where portfolio value erodes silently
Base case drift
Every private equity investment has an entry model: a financial forecast built around a set of assumptions that justified the entry valuation and the returns projected to the IC. Revenue growth at a certain compound rate. EBITDA margins expanding by a specified number of percentage points over the holding period. A debt paydown schedule that reduces leverage to a target level by year three or four. An exit at a multiple within a stated range.
These assumptions do not have to be wrong at entry to cause problems. Markets change. Input costs move. Key customer relationships evolve. A sales leader who was central to the investment thesis departs in month eight. The competitive landscape that the CIM described is different eighteen months into ownership than it appeared in the data room. None of these developments is necessarily catastrophic if it is identified promptly. Each of them is much more expensive if it compounds undetected for two to three quarters before a board meeting surfaces it.
Private equity professionals examine EBITDA on a monthly basis during the monitoring stage of a transaction, because EBITDA is the primary metric that connects operating performance to enterprise value and to the debt covenants that govern the capital structure. The principle is sound. The execution depends on whether the monthly management accounts are structured to make EBITDA comparable to the entry model, whether exceptions are flagged systematically, and whether the person reviewing the accounts has the context to distinguish a timing difference from a structural deterioration.
Reporting lag
Management accounts are typically prepared by the portfolio company's finance function and delivered to the GP on a monthly cadence with a two to six week lag after period close. In a fund with twelve portfolio companies, this means the GP is continuously processing twelve sets of monthly accounts, each with a different close calendar, different reporting format, and different definitions of the key line items that matter for monitoring.
The practical result is that accounts that arrive mid-month for the prior period are reviewed when the deal professional has capacity, which may be three to four weeks after receipt during a live deal process. By the time February management accounts are substantively reviewed in mid-April, the issues they contain are five weeks old. A margin compression that began in January may have been structural for two full quarters before it appears in a board discussion.
Standardizing the format in which portfolio companies report does not fully resolve the lag problem, but it compresses the time required to extract the relevant figures from each set of accounts. If a deal professional can review twelve company KPI dashboards in forty-five minutes rather than three hours of manual spreadsheet work, the monitoring frequency that is operationally feasible rises from monthly to potentially weekly. The frequency matters because the earlier a deviation from base case is caught, the more options the GP has for corrective action.
The financial statement spreading automation processes monthly management account packages and outputs standardized KPI tables, making cross-portfolio comparison tractable even as the number of portfolio companies grows.
Value creation plan execution gaps
The value creation plan is the document that describes how the investment thesis will be realized. It identifies specific initiatives (pricing changes, procurement savings, sales team restructuring, geographic expansion, M&A add-ons) with owners, timelines, and financial impact targets. It is presented to the IC before close. It is reviewed by the board at the first post-close meeting. After that, its fate varies significantly by firm.
In the best-run PE portfolios, the value creation plan is a living operating document. Initiative progress is tracked against milestones at each board meeting. Slippage triggers a structured discussion about causes and options. Financial impact revisions are modeled explicitly and compared against the entry case. The investment team understands whether the company is on its financial plan and whether the operational changes driving that plan are on track.
In a significant number of PE portfolios, the value creation plan becomes a document that describes what was expected rather than a tool that tracks what is happening. Board packs report performance against budget. Budget variances are explained. Whether the budget itself still reflects the original investment thesis, and whether the value creation initiatives that justified the entry valuation are progressing, is a separate question that may or may not be addressed with the same rigor.


Financial statement spreading: the infrastructure of effective monitoring
Financial statement spreading is the process of extracting income statement, balance sheet, and cash flow data from portfolio company management accounts and presenting it in a standardized format for analysis and comparison. In the context of PE portfolio monitoring, it is the operational foundation on which everything else depends.
Without a spreading process, deal professionals receive management accounts in whatever format the company's finance team produces: a PDF of the month's income statement and balance sheet, a Word document with narrative commentary, or an Excel workbook that uses different naming conventions than the entry model. Reading these documents individually is possible. Comparing them to the entry model, to prior months, to peer companies in the same sector, and to budget is a manual process that takes time that most PE monitoring workflows cannot consistently allocate.
With a spreading process, a standardized data extract from each monthly pack sits alongside the historical series and the entry model in a format that makes comparison immediate. Gross margin this month versus last month versus the entry model assumption. Revenue by segment against the budget line that was built to track whether the sales restructuring initiative is working. Cash conversion versus the debt paydown schedule that the lender monitors for covenant compliance. These are not complicated analyses. They are time-consuming to do from scratch each month across a portfolio of twelve companies.
The financial statement spreading automation that AI tools now support processes management account documents, extracts the relevant figures regardless of format, and outputs a normalized data structure for each company. The deal professional receives a summary that is already comparable to the prior month and to the entry model, rather than a PDF that requires manual extraction before any comparison is possible. This does not replace the judgment about what the numbers mean. It eliminates the manual work that has historically meant those numbers are compared too infrequently.
The multiple expansion problem and what replaces it
For most of the 2010s, private equity buyout returns were substantially driven by multiple expansion: entry multiples in the 8-10x EBITDA range, exit multiples in the 11-13x range, with leverage financing much of the remainder. This dynamic reduced the pressure on operational improvement. A portfolio company that grew revenue modestly and maintained margins could deliver attractive returns if exit multiples had expanded during the holding period. The monitoring obligation was relatively forgiving because the tide was rising.
That environment has changed. McKinsey's analysis finds that "buyout managers on average have essentially ignored margin growth as a driver of value over the last decade and have been carried along by multiple expansion." With buyout entry multiples remaining elevated and exit multiples under pressure from higher interest rates and a more selective buyer universe, the margin improvement that was optional in 2015 has become necessary in 2026. Revenue growth at 71% of value creation at exit does not happen automatically. It is the output of specific operational changes that require monitoring to execute.
The firms that perform best in this environment are those whose portfolio monitoring infrastructure makes them the first to know when a portfolio company is underperforming its revenue growth plan, and whose organizational structure allows them to act on that information before it becomes material. A deal professional who learns in September that the sales initiative launched in January has underperformed can still redirect resources, change the management incentive structure, or revise the M&A add-on plan for the company. The same professional learning this in a December board review has lost nine months of optionality.
AI tools in PE portfolio monitoring support financial analysis, automated financial statement extraction, and ongoing compliance monitoring across portfolio companies, replacing manual reporting cycles with structured data flows.
Covenant monitoring: the signal that most firms read too late
Every leveraged buyout involves debt covenants: financial maintenance tests, typically based on leverage ratios and interest coverage, that must be met at specified measurement dates. A covenant breach triggers consequences that can include increased borrowing costs, mandatory amortization requirements, and in the worst cases, lender intervention that forces the GP into a restructuring conversation at a moment of the lender's choosing rather than the GP's.
Covenant headroom does not disappear suddenly. It erodes. A company that enters with 30% headroom on its leverage covenant loses five percentage points per quarter as EBITDA misses plan and debt repayment lags. The GP who is reviewing management accounts monthly with a spreading tool sees the headroom number trend clearly over six months. The GP who is reviewing accounts quarterly sees two data points and may interpret an isolated underperformance as timing rather than trend.
The Federal Reserve's research on PE-backed covenant violations found that PE-sponsored borrowers face relatively fewer adverse lender responses after a violation, partly because GP reputation and sponsor relationships create goodwill that non-PE borrowers do not enjoy. This dynamic, while real, also creates a perverse incentive: it reduces the urgency of covenant monitoring for GPs who expect to manage their way through a violation with lender goodwill. The cost is not always absorbed by the GP. It is sometimes absorbed by the portfolio company in the form of higher interest costs, restricted flexibility to pursue add-on acquisitions, or management attention redirected from operations to a bank relationship under pressure.
How AI document analysis changes the monitoring economics
The monitoring problem is not a data problem. Portfolio companies produce management accounts. They submit board packs. They run budget processes that generate financial forecasts. The information that would support effective monitoring is being produced. The barrier is the extraction, normalization, and comparison process that transforms raw documents into actionable signals.

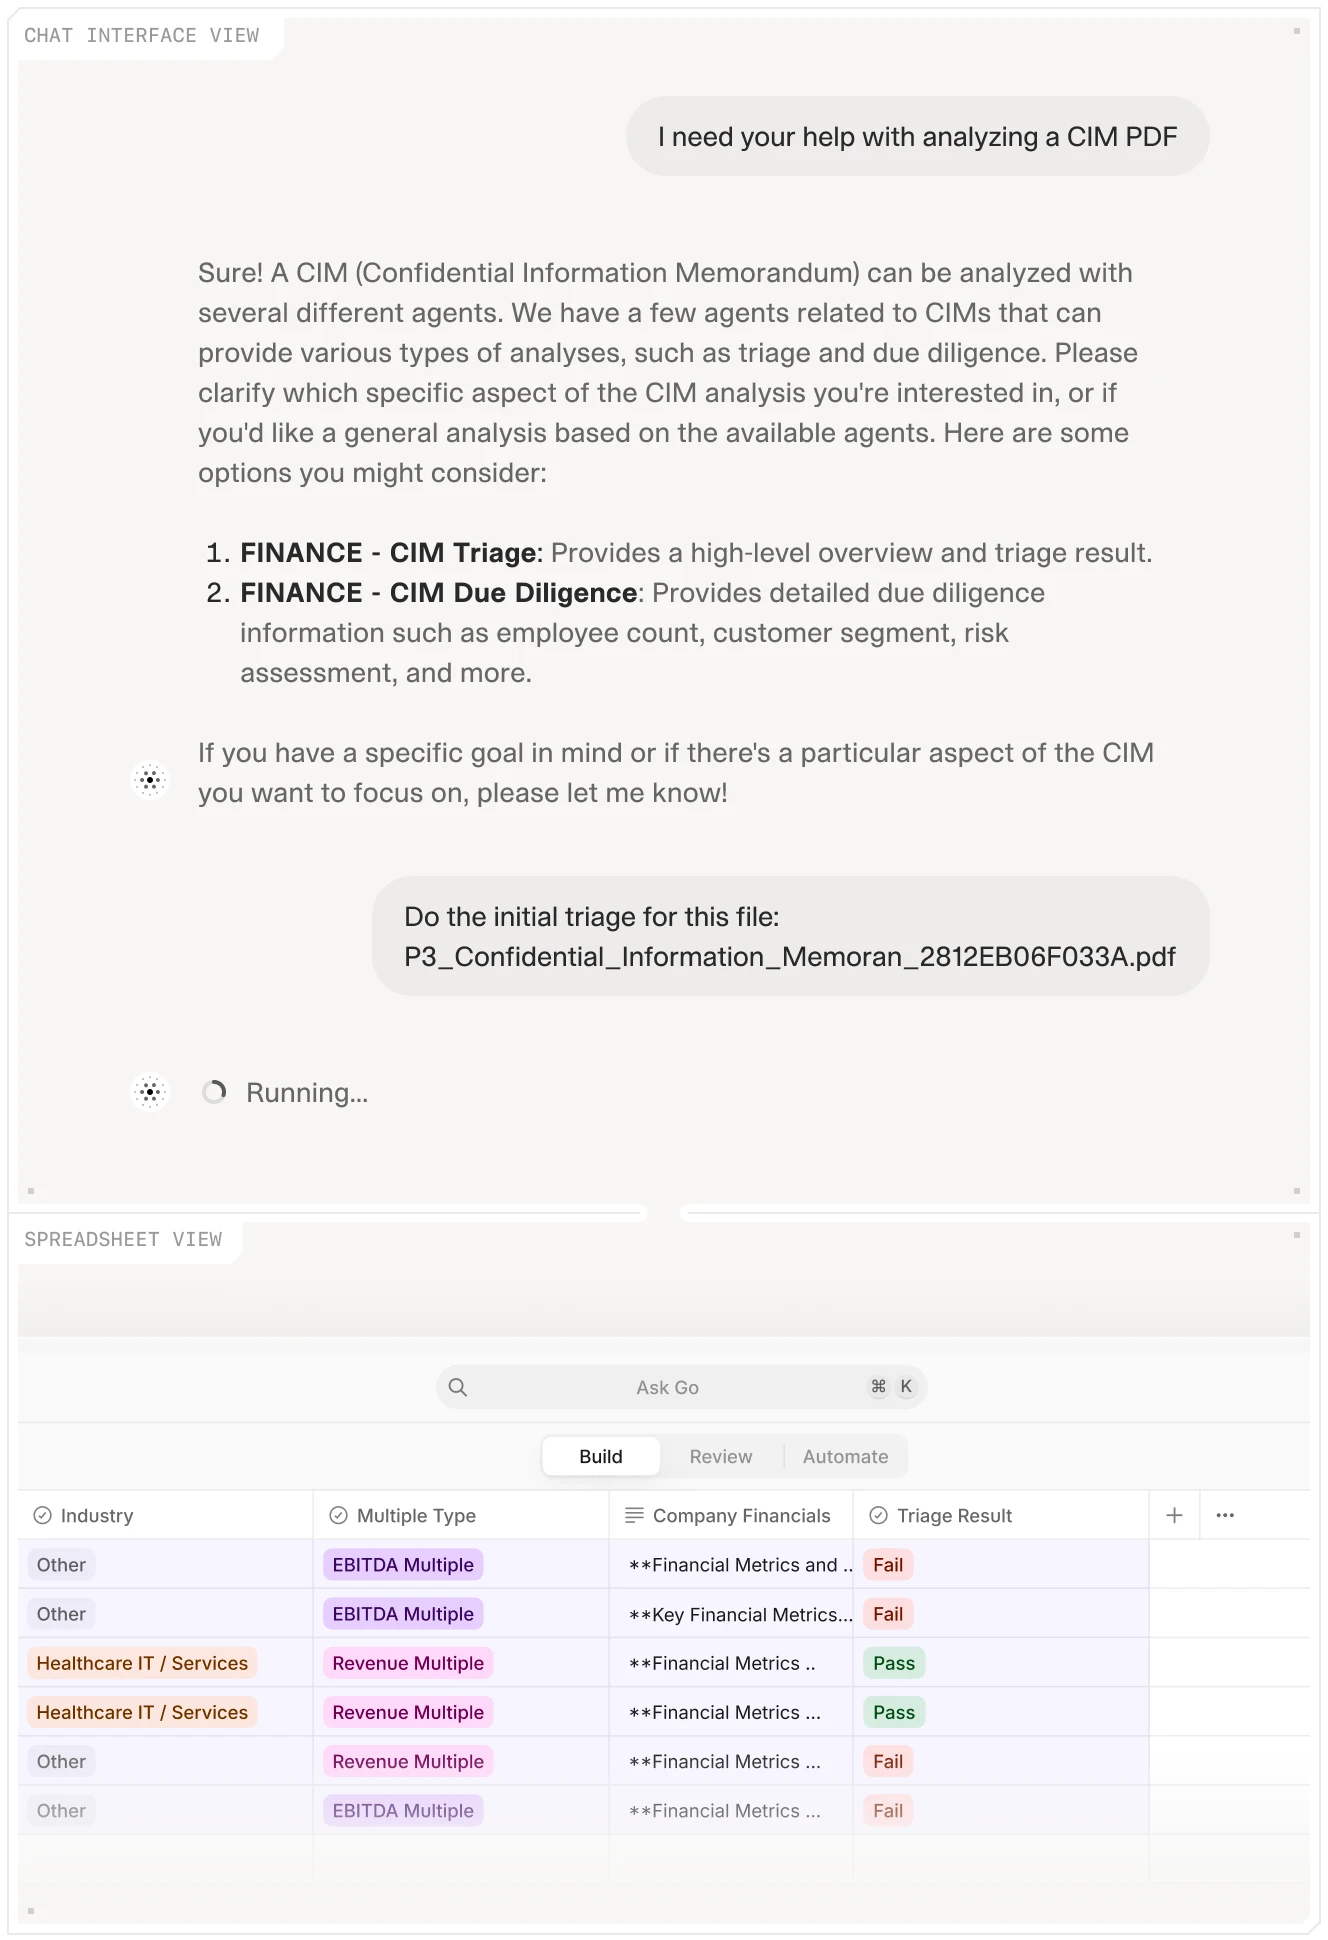
An AI document tool applied to a PE monitoring workflow operates in two places. The first is inbound document processing: management account PDFs, board packs, and quarterly reports are ingested, financial data is extracted into a standardized schema, and the output is a comparable monthly data series for each portfolio company. The second is exception flagging: the tool identifies where the current period data deviates materially from the prior period, from the budget, or from the entry model assumption for the same line item. A deal professional reviewing twelve companies does not need to read twelve sets of accounts to know that three companies show margin compression this month and one shows a revenue miss against the specific segment that was flagged as highest-risk in the IC memo.
The role of AI in financial document analysis has been most extensively discussed in the context of deal due diligence. The same underlying capability applies to portfolio monitoring: the ability to extract structured financial data from unstructured documents at scale, normalize it across different formats, and surface anomalies that require human attention. The deal use case is a single transaction under time pressure. The monitoring use case is an ongoing process across a portfolio that runs for the full life of the fund.
For firms managing fifteen to twenty portfolio companies across multiple fund vintages, the economics change substantially. Manual spreading of twelve monthly accounts takes a junior professional several hours per company per month. Automated spreading reduces that to review and validation. The time freed is available for the analysis and engagement work that actually moves portfolio company performance.
What effective portfolio monitoring actually looks like in the age of generative AI
Effective portfolio monitoring has five components that most PE firms have in principle but few have working together in practice.
The first is a standardized data model. Every portfolio company reports into the same schema: revenue by segment, gross margin, EBITDA, cash conversion, net debt, and the two or three company-specific KPIs that were identified as leading indicators in the investment thesis. This schema is agreed at close, documented in the monitoring framework, and embedded in the format the company's finance team uses to prepare management accounts.
The second is a comparison baseline. Each monthly data point is compared to the prior month, to the budget, and to the specific entry model assumption for the same period. The comparison is built into the spreading template or the monitoring tool, rather than performed manually each period. Variances are flagged automatically, not identified by whoever happens to notice them while reading a PDF.
The third is a value creation plan tracking tool. The operational initiatives in the VCP have milestones, owners, and financial impact targets. Progress against milestones is reported at each board meeting alongside the financial KPIs. A revenue growth plan that depends on a new sales leader being hired by month four is tracked against that milestone alongside the revenue line that the hire was meant to drive.
The fourth is a response protocol. A monitoring system that identifies problems but does not have a defined response process does not protect returns. It delivers bad news with better timing, which is useful but insufficient. Effective monitoring frameworks define what triggers a GP response, who owns the response, and what form it takes: a management discussion, an operating partner engagement, a board agenda change, or a refinancing conversation with the lender.
The fifth is escalation clarity. Not every variance requires the same response. A margin miss in a seasonal business in a known low-margin quarter is different from a margin miss in a business where margin expansion was a central assumption of the investment thesis. Monitoring frameworks that treat all variances equally generate noise that causes deal professionals to become less attentive to the alerts, defeating the purpose of having them.
The firms that build all five components into their portfolio monitoring workflow are the ones that consistently find problems early enough to have options. Early detection of a revenue shortfall leaves time for a sales motion correction, a pricing adjustment, or a product pivot. Late detection leaves time for an accelerated exit process to avoid the next reporting period, or a debt restructuring conversation that the lender is initiating rather than the GP.
The due diligence process that LPs run on GPs increasingly includes questions about portfolio monitoring infrastructure: how frequently do you review management accounts, what KPIs do you track at the fund level, how do you identify early-stage portfolio problems? LPs who have experienced a fund that delivered poor returns from a portfolio of companies that were underperforming for eighteen months before the GP noticed are asking these questions because the answer predicts, with reasonable accuracy, whether the GP's investment thesis will be executed or merely described.
The monitoring edge that few firms advertise
Every GP pitch deck describes the firm's value creation capabilities. Operating partners with sector experience. A portfolio operations team with functional depth. A network of advisers who can be deployed to specific companies. The capability is real in many cases. What is less consistently real is the infrastructure that makes those capabilities actionable rather than available in principle.
A portfolio operations team that is not receiving standardized monthly data from each portfolio company is operating reactively rather than proactively. An operating partner whose awareness of a company's trajectory depends on attending quarterly board meetings is seeing a sampling of the business's performance, not its direction. A deal professional who is reading management accounts four weeks after period close in the middle of a live deal process is doing monitoring on a schedule determined by competing priorities rather than by when the information is actionable.
The AI document tools that support financial statement spreading and portfolio monitoring do not replace any of these people. They change the ratio of time spent extracting information to time spent acting on it. In a portfolio of fifteen companies, the difference between spending three hours per company per month on manual spreading and thirty minutes on review and validation is the equivalent of a full-time analyst's capacity, redirected from data preparation to operational engagement.
The firms that will outperform in the current environment are the ones that have recognized that the multiple expansion era required different skills than the revenue growth and margin improvement era. The monitoring infrastructure that was adequate when a rising tide carried most portfolios to acceptable exits is inadequate when returns depend on executing operational plans that have to be tracked milestone by milestone, month by month, across a portfolio of companies that are simultaneously managing their businesses and responding to a macroeconomic environment that the entry model could not have anticipated.
This is where the money that PE firms never notice they are losing actually goes. Not in bad deals. In good deals that were monitored too infrequently to catch the drift before it became direction.

What is portfolio monitoring in private equity?
Portfolio monitoring in private equity is the process by which a GP tracks the operational and financial performance of each portfolio company during the holding period between acquisition and exit. It involves reviewing monthly management accounts, comparing performance against the investment base case and budget, tracking progress on the value creation plan, monitoring debt covenant headroom, and identifying early-stage problems that require GP engagement or intervention. Most PE firms monitor portfolio companies through a combination of board representation, monthly management account review, quarterly investor reporting, and direct engagement between deal professionals or operating partners and portfolio company management teams. Effective portfolio monitoring requires a standardized reporting framework, systematic comparison of results to the entry model, and a defined response protocol for material variances.
+
Why is portfolio monitoring more important now than in the previous decade?
Portfolio monitoring has become more consequential as the sources of private equity returns have shifted. Through most of the 2010s, multiple expansion contributed significantly to buyout returns, meaning that companies that performed modestly could still deliver attractive fund-level outcomes because exit multiples were rising. McKinsey analysis found that buyout managers on average largely ignored margin growth as a value driver during this period and were carried by multiple expansion. In the current environment, revenue growth accounts for 71% of value created at exit (2024 data), up from 64% in 2023, while multiple expansion has contracted as higher interest rates and more selective buyers compress exit valuations. Operational improvement through the holding period has become the primary lever available to GPs. McKinsey's study of more than 100 PE funds with vintages after 2020 found that GPs focused on operational value creation achieve two to three percentage points higher IRR than peers. That margin depends on monitoring infrastructure that identifies underperformance early enough to correct course.
+
What financial metrics do PE firms monitor in portfolio companies?
Private equity firms typically monitor portfolio companies against a combination of financial metrics and operational KPIs derived from the investment thesis. The core financial metrics are revenue and revenue growth by segment, gross margin, EBITDA and EBITDA margin, cash conversion (EBITDA to free cash flow), net debt, and leverage ratio. These metrics are compared to the prior period, to the annual budget, and to the entry model projection for the same period. EBITDA receives particular attention because PE firms most frequently think of entry and exit valuations as multiples of EBITDA, and EBITDA maintenance is directly relevant to debt covenant compliance. Beyond financial metrics, effective monitoring tracks the operational milestones in the value creation plan: whether specific initiatives are on schedule, whether the management team changes that were planned have been implemented, and whether the commercial or operational improvements that justified the entry valuation are materializing on the timelines the IC assumed. The two or three company-specific leading indicators identified in the investment thesis, such as sales pipeline health, customer retention, or production efficiency, are typically tracked alongside the standard financial metrics.
+
How does the J-curve affect the monitoring obligation in PE?
The J-curve describes the typical pattern of a private equity fund's NAV over its life: an initial decline in the early years as management fees reduce NAV and capital is deployed into unrealized investments, followed by recovery as portfolio companies mature and exits generate distributions. For portfolio monitoring purposes, the J-curve creates a specific risk: the years when fund returns are most negative on paper are also the years when portfolio companies are most operationally exposed, as post-acquisition integration actions are executing, value creation plan milestones are first being tested, and the investment assumptions are encountering real-world conditions for the first time. These early years are also the period when visibility is lowest for LPs, because NAV reflects unrealized positions marked by the GP under fair value standards rather than realized outcomes. A portfolio company underperforming its base case in year two may not surface in GP-to-LP reporting until a financing event, management change, or significant margin miss makes it unavoidable. The monitoring obligation is therefore highest in years one and two post-close, even though PE firm attention is often most distributed at that time, with deal professionals simultaneously onboarding new portfolio companies while monitoring existing ones.
+
What is financial statement spreading and why does it matter for PE portfolio monitoring?
AI document analysis supports private equity portfolio monitoring in two primary ways. The first is financial statement spreading: management account documents, board packs, and quarterly reports are processed by an AI extraction agent that identifies and extracts the relevant financial figures, normalizes them against a standardized schema, and outputs a structured data table comparable across portfolio companies and time periods. This replaces the manual extraction step that has historically made monthly monitoring of large portfolios operationally impractical. The second is exception detection: the AI tool can identify where current period data deviates materially from the prior period, from the budget, or from the entry model assumption for the same line item. A deal professional monitoring twelve portfolio companies receives a summary of the exceptions that require attention rather than twelve separate sets of accounts requiring individual reading to identify the same issues. Additional applications include covenant headroom monitoring, where the tool tracks leverage and coverage ratios against covenant thresholds on a monthly basis, and value creation plan milestone tracking, where the tool can extract milestone progress from board pack narrative and flag delays. The time freed by automating these extraction and comparison steps is available for the management engagement and operational problem-solving work that actually improves portfolio performance.
+
How does AI document analysis support PE portfolio monitoring workflows?
Go is more accurate and robust than calling a model provider directly. By breaking down complex tasks into reasoning steps with Index Knowledge, Go enables LLMs to query your data more accurately than an out of the box API call. Combining this with conditional logic, which can route high sensitivity data to a human review, Go builds robustness into your AI powered workflows.
+
Casimir is a seasoned tech journalist and content creator specializing in AI implementation and new technologies. His expertise lies in LLM orchestration, chatbots, generative AI applications, and computer vision.

