9 min read
—


Every quarter, the same thing happens at PE firms across the industry. Portfolio performance reporting begins. The cycle opens, someone emails the portfolio companies asking for their latest KPIs, and the responses arrive over the next two weeks in eight different spreadsheet formats, three of which are missing the EBITDA bridge. Two portcos send PDFs. One sends a PowerPoint. A junior analyst spends four days normalising everything into a master template before anyone has run a single calculation.
Then the IRR reconciliation starts.
That is not a niche problem. According to Allvue Systems' investor reporting guide, 70% of GPs name LP reporting as their top operating challenge, and the bottleneck is almost never the metrics. The problem is the two weeks of data collection that happens before the analysis can begin.
This article is about portfolio performance reporting: what it measures, which metrics matter and why, how to benchmark fund performance against public markets, and specifically where AI can compress the reporting cycle without compromising accuracy or auditability.
In this article:
What portfolio performance reporting measures and why it differs from portfolio monitoring.
What the ILPA Performance Template (2025) now requires GPs to disclose, and what changes for funds from January 2026.
How AI automates the data collection and normalisation stages that consume most of the reporting cycle.

AI for document processing
Automate portfolio reporting so your team focuses on decisions
Get started today
What portfolio performance reporting actually measures
Portfolio performance reporting is the periodic, retrospective process by which a PE fund communicates realised and unrealised investment returns to its limited partners, investment committee, and, in some structures, regulators.
It answers two questions:
How much value has the fund created relative to the capital invested?
How does that compare to what an LP could have earned elsewhere?
A typical quarterly LP report contains five components.
A schedule of investments listing every portfolio company with acquisition date, cost basis, current fair value, and ownership percentage.
A fund-level performance summary showing the headline return metrics.
A portfolio company narrative, typically a one-page per portco summary of the period's key developments, risks, and milestones.
A financial statement summary (balance sheet, income statement, cash flows at fund level).
And the GP letter: the narrative that frames all of it.
4 key metrics in portfolio performance reporting
Below is a brief introduction to some of the key terms that appear in portfolio performance analysis and reprorts.
The annualized rate of return that makes the net present value of all cash flows equal to zero; it accounts for the timing of capital calls and distributions. A higher IRR is better, but it can be inflated by early exits or a short hold period.
The ratio of total value (realized + unrealized) to the capital investors have actually contributed. A TVPI of 1.5x means every dollar invested is currently worth $1.50, but it includes paper gains until distributions are made.
The portion of TVPI that represents realized returns, which means cash actually returned to investors relative to contributed capital. It's the most concrete measure of a fund's performance, since nothing is counted until money is in hand.
The unrealized complement to DPI, reflecting the estimated current value of remaining portfolio holdings relative to paid-in capital. It depends heavily on how conservatively or aggressively the manager marks positions, so it warrants scrutiny — especially in early-stage funds.
Most firms produce some version of this package every quarter. The difference between a firm that completes the cycle in five business days and one that takes three weeks is almost always the same thing: data infrastructure.
The metrics are not the hard part. Getting clean, comparable, timestamped data from eight portfolio companies that each built their own finance function independently before the GP acquired them, that is the hard part.
What the ILPA Performance Template now requires
In January 2025, the Institutional Limited Partners Association released two new templates as part of its Quarterly Reporting Standards Initiative: an updated Reporting Template (replacing the 2016 version) and a new, first-ever Performance Template. Both represent the most significant standardisation push the industry has seen in a decade.
The ILPA Performance Template standardises how GPs calculate and present both gross fund-level performance and portfolio-level metrics. It offers two methodologies, Granular (for GPs using fund-to-investor cash flows who itemise each capital call) and Gross Up (for GPs using fund-to-investment cash flows), covering gross and net IRR, TVPI, DPI, RVPI, contribution and distribution pacing, and additional LP comparability metrics. For the first time, LPs can compare returns across fund managers using a consistent calculation methodology rather than attempting to reconcile competing proprietary approaches.
The updated Reporting Template also tightens disclosure requirements around fees and expenses: placement fees, partner transfers, subscription facility fees and interest, third-party expenses, and portfolio company fees now require more granular disclosure than the previous template demanded. GPs who relied on aggregated line items in prior reports will need to restructure their reporting data architecture, not just their templates.
The compliance pressure from ILPA is landing at the same moment that AI tooling for document processing and financial data extraction has become genuinely usable. That timing matters: the firms moving fastest on ILPA compliance are largely the same firms investing in AI-assisted reporting infrastructure, and the adoption gap between large and small managers is already measurable.
Why the quarterly reporting cycle is still broken at most firms
A standard quarterly reporting cycle at a mid-market buyout firm with eight portfolio companies looks something like this. The cycle opens six weeks before the LP report delivery date. An associate or VP of Finance sends data request emails to each portco CFO asking for the latest management accounts, KPI scorecard, and narrative update. Over the next two weeks, responses arrive. Some portcos send Excel files. Some send PDFs of board decks. One sends a password-protected document that requires three follow-up emails. The formats are different for every company because each was built independently before the GP acquired it.
That data, arriving in eight formats across two weeks, then needs to be normalised: revenue extracted from management P&Ls, EBITDA reconciled against different accounting treatments, net debt figures cross-checked against the bank facilities. A single data entry error in one spreadsheet cascades through the TVPI calculation for the entire fund. Catching it requires going back to the source document and tracing each figure manually.
The data collection and normalisation phase consumes 60-70% of the reporting cycle at most firms that have not systematised it, and then it repeats identically next quarter.
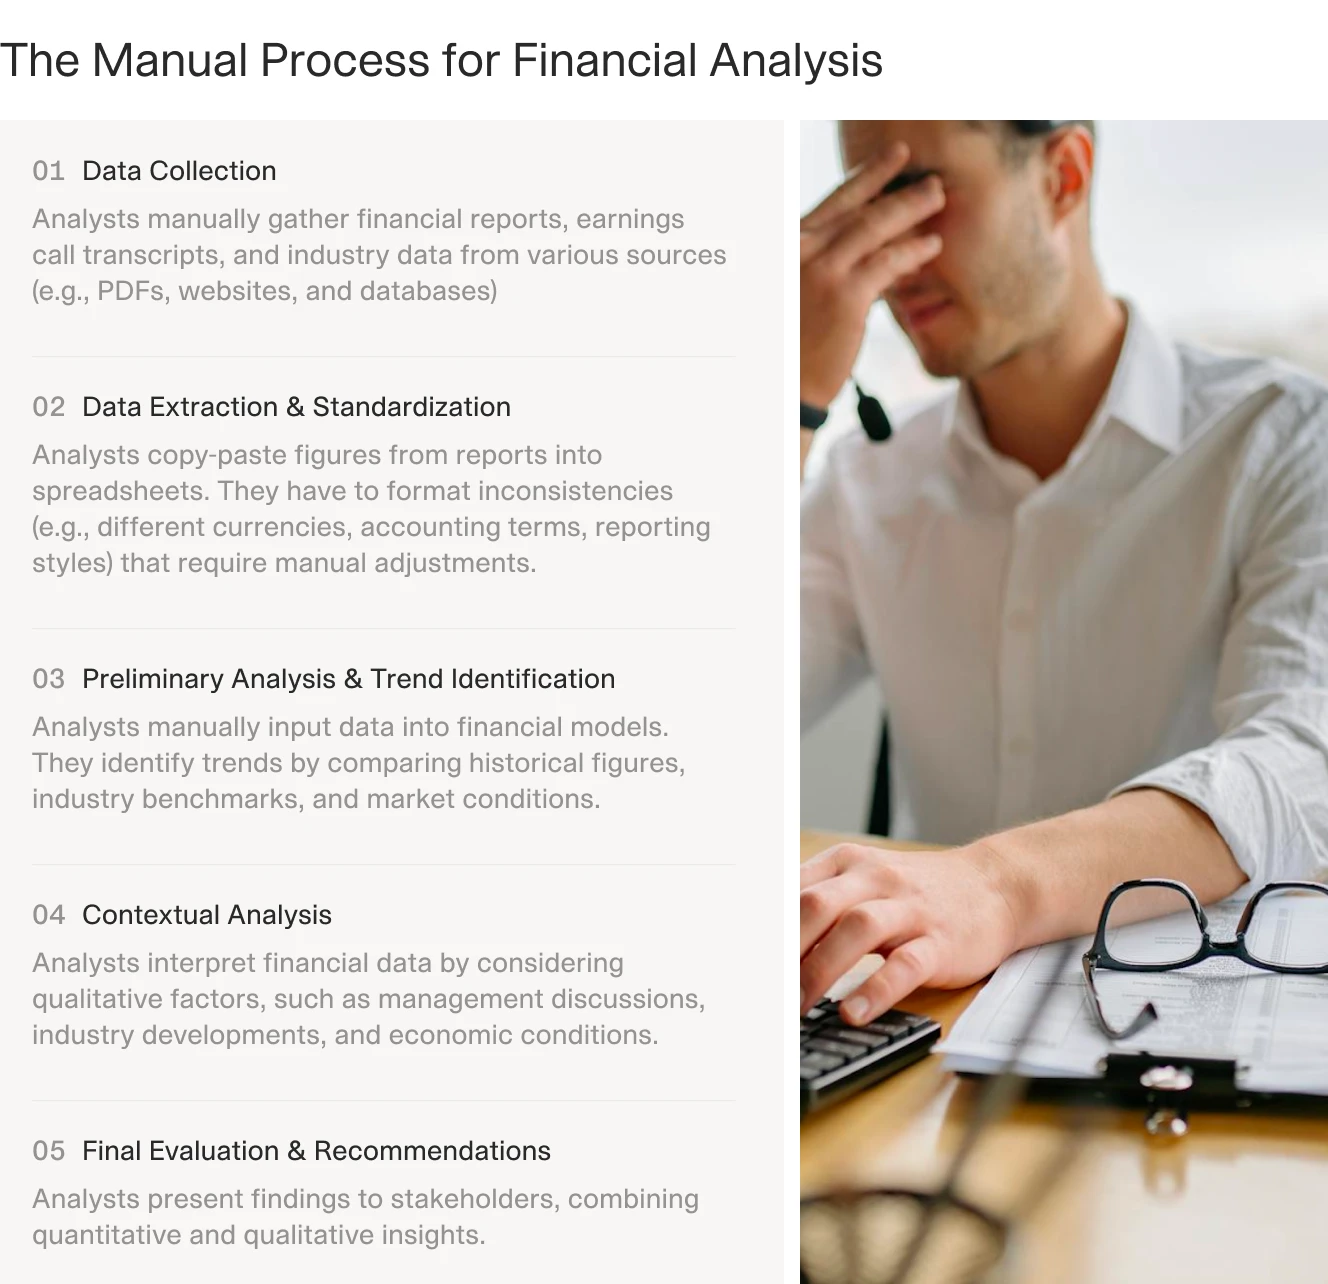
The manual quarterly reporting cycle spans five sequential stages before a single LP figure is ready. Data collection and normalisation sit at the front, and they consume most of the first two weeks. This is the bottleneck AI is actually well positioned to close.


How AI automates portfolio performance reporting
The part of portfolio performance reporting that AI addresses well is precisely the part that consumes most of the cycle: reading documents, extracting structured data, normalising it against a consistent schema, and flagging discrepancies for human review.
The part AI does not address, and should not be expected to address, is the judgment calls: whether a portco's revised revenue recognition policy is acceptable, whether to adjust the fair value assumption on an underperforming asset, or how to frame a difficult narrative for LP consumption. Those stay with the fund team.
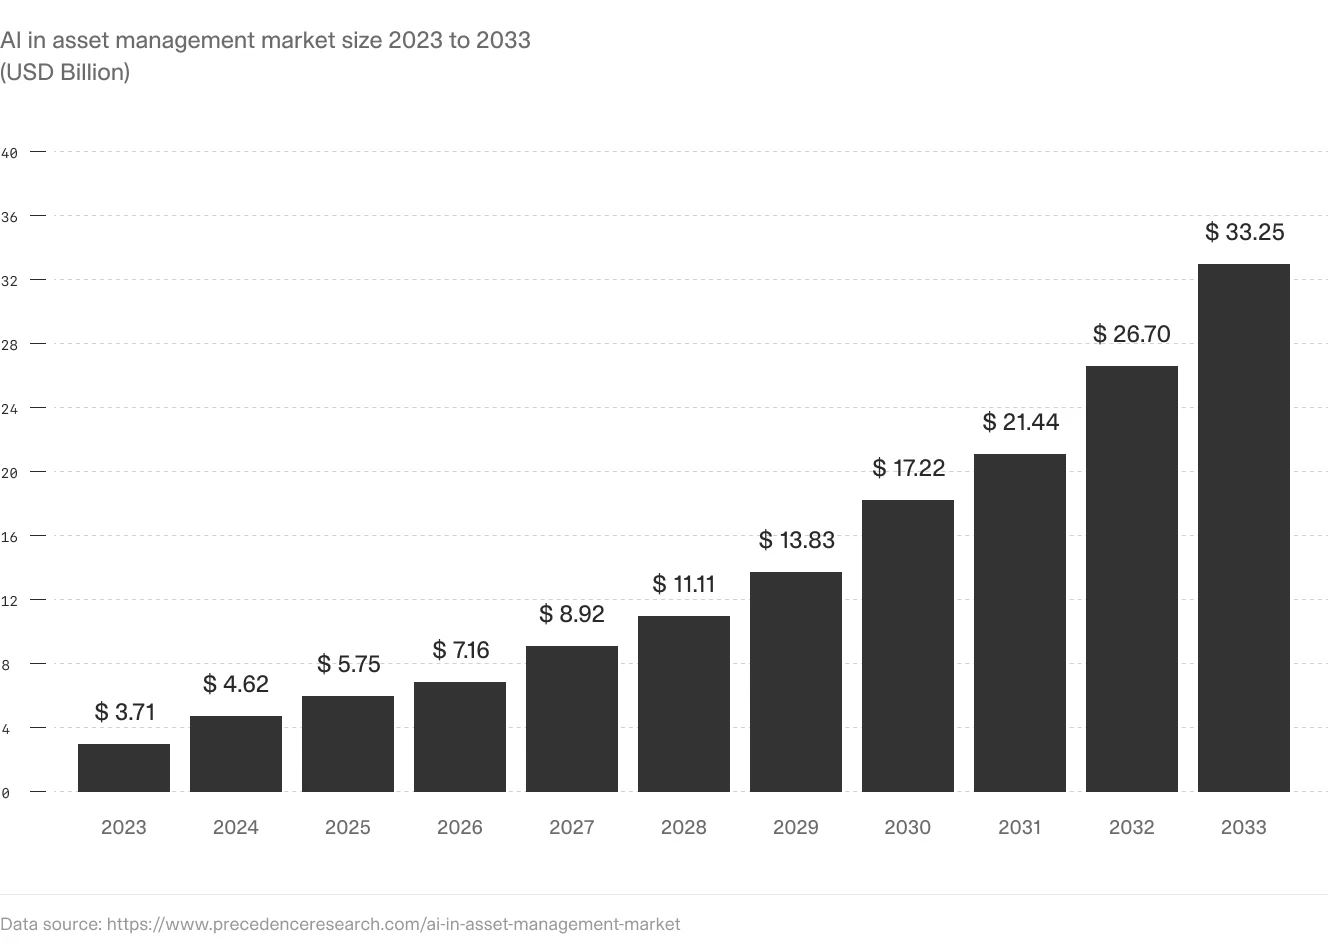
AI adoption in asset management is on a steep growth curve, projected to reach $33 billion by 2033. Portfolio performance reporting, specifically the data gathering and normalisation phase, is one of the highest-leverage workflows driving that adoption.
V7 Go for portfolio performance reporting
What changes with AI is the data infrastructure layer. Instead of emailing portcos and waiting for responses, a GP can configure an AI agent to ingest the portco financial packages, whatever format they arrive in, whether PDF management accounts, Excel KPI reports, or Word board decks, and extract a defined set of fields against a standardised schema. Revenue. EBITDA. Net debt. Working capital movement. Specific KPIs defined in the fund's value creation framework.
The agent runs the same extraction logic against every portco document in the portfolio, producing structured data that flows directly into the reporting model.
The critical requirement for this to be credible to LPs and auditors is traceability. An AI extraction that produces a revenue figure without linking it back to the source page in the management accounts is not useful for a fund with institutional LP oversight.
This is where Visual Grounding matters: every extracted figure is linked to its exact location in the source document. If a portco's Q2 revenue figure is extracted from page 7 of their management accounts, the agent's output shows the figure, the page, and the highlighted passage it came from. When an LP queries a number, the GP can produce the audit trail immediately instead of spending two days tracking it down.
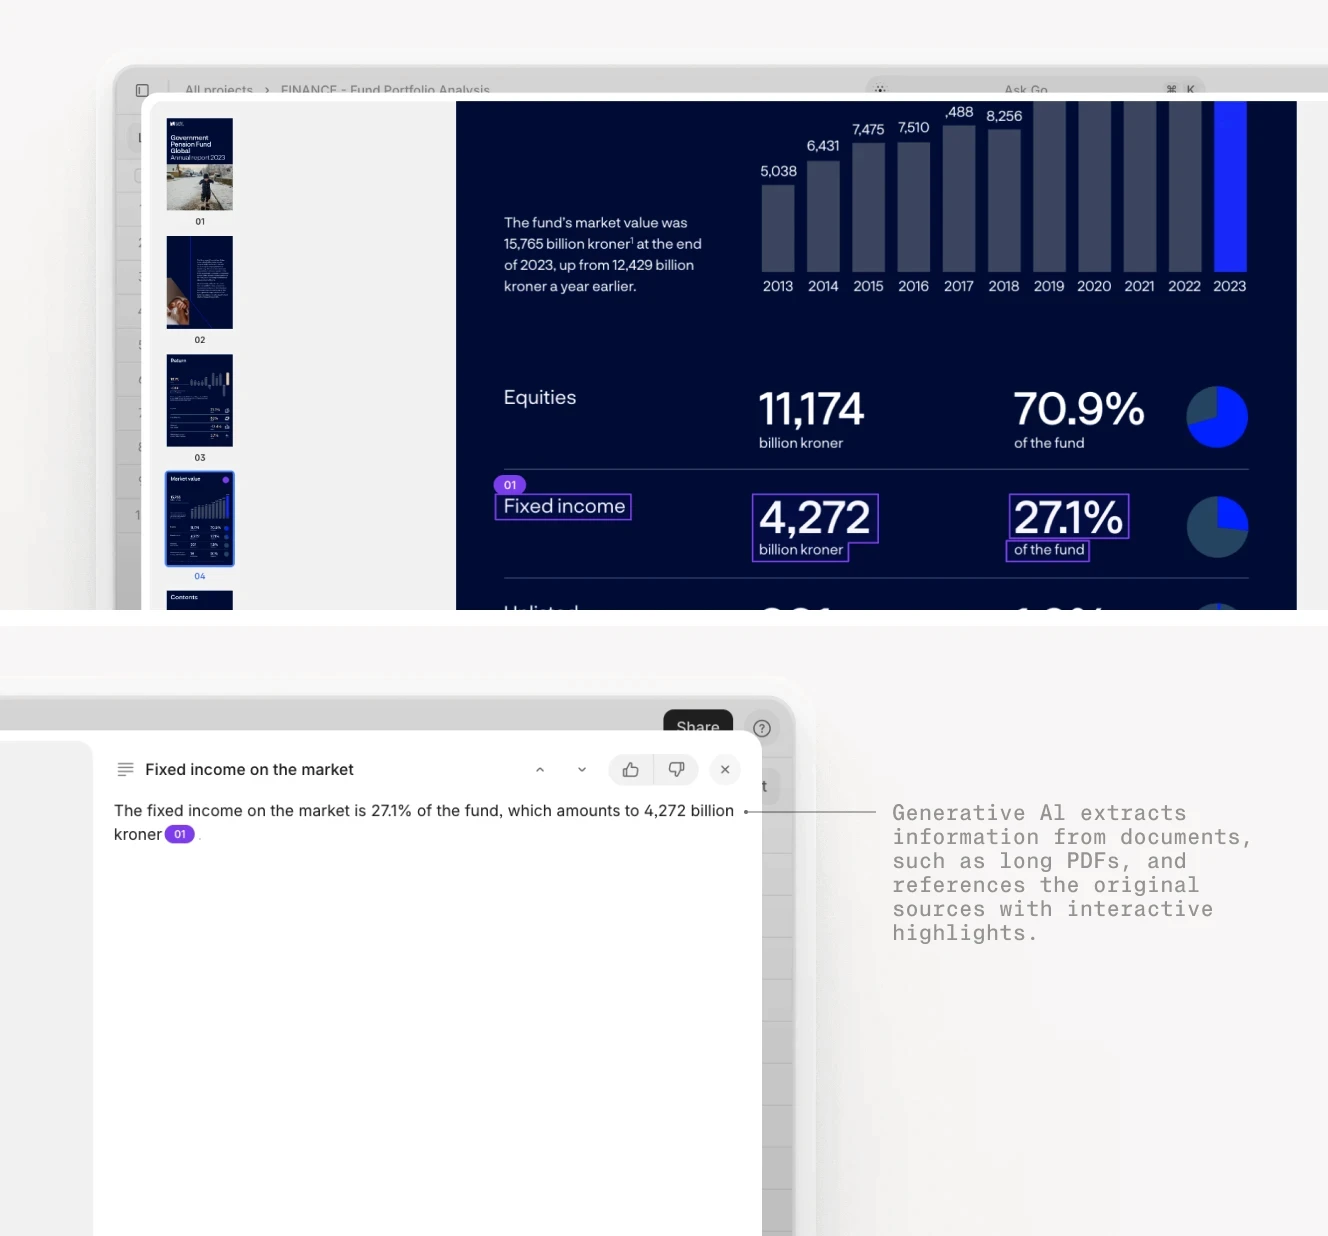
V7 Go's AI Citations link every extracted figure to its exact source passage in the original document.
Metric calculation, IRR, TVPI, DPI, MOIC, requires deterministic arithmetic, not language model inference. V7 Go's Python Tool enables a fund to embed custom calculation logic directly inside the agent workflow: cash flow series are passed to a Python function that calculates net IRR according to the fund's specific fee and waterfall structure, without requiring an external spreadsheet. The calculated figures feed back into the structured output alongside the extracted portco data.
This is an important distinction. Generative AI is not a calculation engine, and it should not be used to compute IRR or TVPI from raw cash flows. The Python Tool handles the calculation deterministically; the LLM handles the extraction, reasoning, and gap-flagging.
Once extracted and calculated data has been reviewed by the fund team, it flows via API or MCP connector into the GP's fund accounting system or reporting template.
V7 Go can also generate the structured Excel export that many fund administrators expect for the schedule of investments and performance summary.
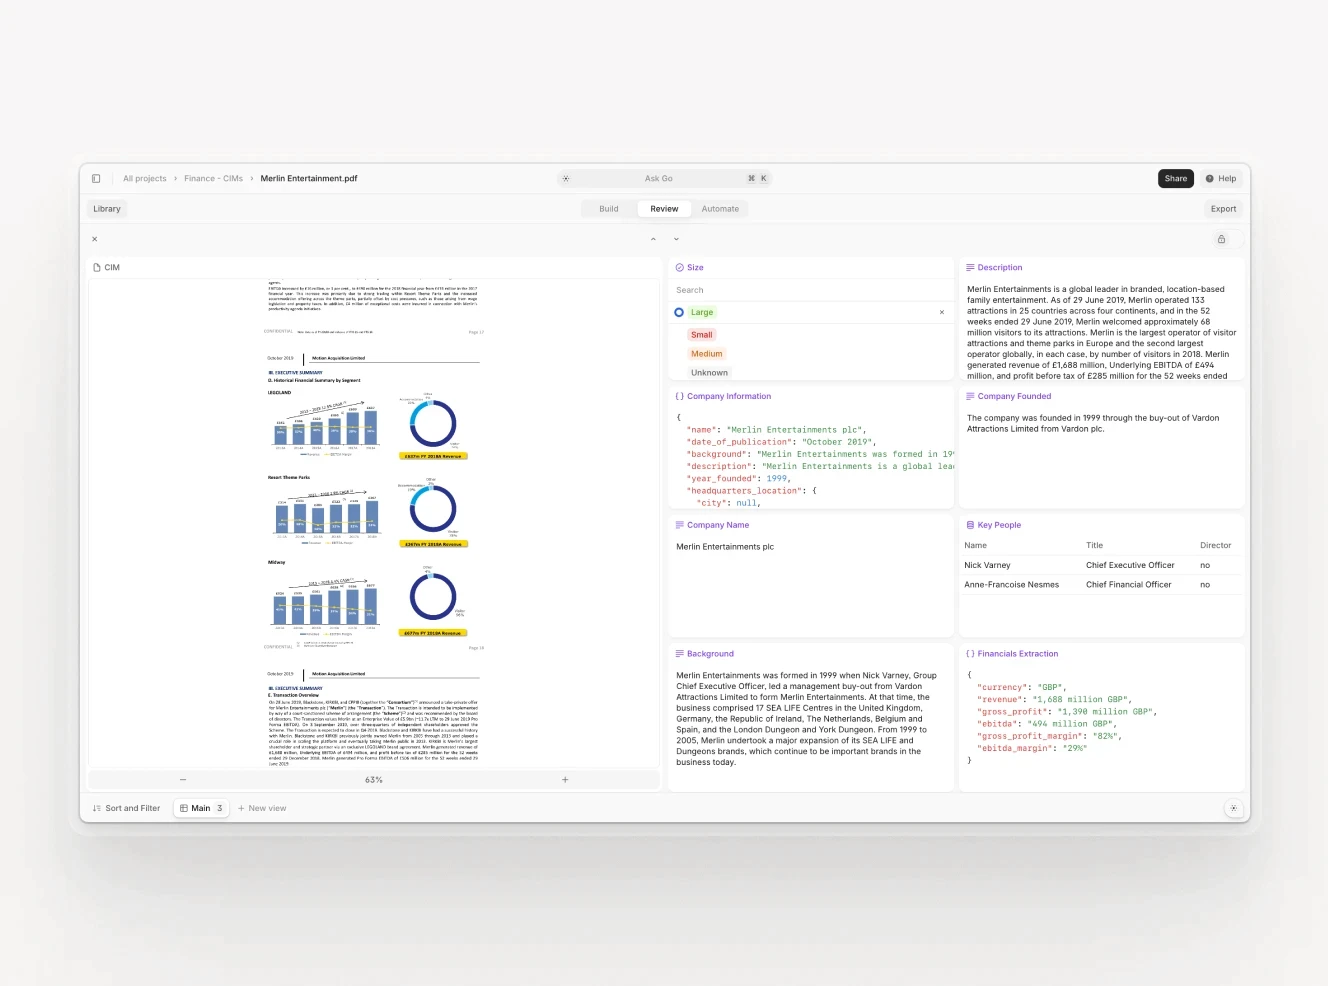
V7 Go's extraction view maps each portco's financial data to the GP's defined schema — revenue, EBITDA, net debt, fund-specific KPIs — with every figure anchored to its source passage. Analysts review structured output, not raw documents.
The result, in practice: the data gathering and normalisation phase that typically consumes the first two weeks of a six-week reporting cycle compresses to one to two business days. The fund team spends more time on analysis, narrative, and LP communication, and less time chasing spreadsheets.
To learn more or see it in action, check out the V7 Go Portfolio Reporting Agent.
Automate your portfolio performance reporting with V7 Go
The ILPA 2025 Performance Template raises the bar for what GPs must disclose. Cambridge Associates' benchmarking data sets a higher standard for what good performance looks like, compared against. LPs conducting operational due diligence are asking harder questions about how figures are derived. All of these pressures point in the same direction: GPs who treat reporting infrastructure as an administrative overhead are going to find it increasingly expensive.
Those who treat it as a core operational capability, and build it accordingly, will have a competitive advantage in LP relations, secondary market transactions, and the next fundraising cycle.
To see it in action, book a demo with our expert team.

What is the difference between portfolio performance reporting and portfolio monitoring?
Portfolio monitoring is the continuous, operational tracking of portfolio company health between reporting periods — revenue growth, EBITDA trends, cash position, headcount — designed to surface problems early and inform value creation decisions. Portfolio performance reporting is the formal periodic disclosure of realised and unrealised returns to limited partners and investment committees, typically quarterly and annually. Monitoring is a management tool; reporting is a governance obligation. The data used in monitoring often feeds into performance reporting, but the two workflows have different audiences, different frequencies, and different standards. LPs receive performance reports. The GP's investment team uses monitoring data. Conflating them is one of the most common reasons firms underinvest in their reporting infrastructure — they assume that because they do monthly monitoring, quarterly reporting will be straightforward. The data formats, aggregation requirements, and presentation standards are different enough that firms usually need separate workflows for each.
+
What is the difference between IRR and TVPI, and when should each be used?
IRR (internal rate of return) is an annualised, time-weighted return that accounts for both the magnitude and timing of cash flows. It tells you the compounded annual growth rate implied by the fund's investment and distribution history. TVPI (total value to paid-in capital) is a simple multiple of total value — distributions plus residual NAV — divided by total capital called. IRR is better for comparing investments with different durations; TVPI is better for understanding absolute value creation regardless of time. A fund could have a high IRR with a low TVPI if exits happened quickly but at modest multiples. Conversely, a fund with a high TVPI but low IRR has created significant absolute value but took a long time to do it — a distinction that matters for LPs who measure their own performance annually against a benchmark. Best practice is to report both in every LP package, alongside DPI (distributions only) to show how much has been realised versus held on paper.
+
What does the ILPA Performance Template released in 2025 require GPs to disclose?
The ILPA Performance Template was released by the Institutional Limited Partners Association in January/February 2025 as part of its Quarterly Reporting Standards Initiative. It standardises gross and net IRR, TVPI, DPI, and RVPI reporting at both fund and portfolio company level, using two calculation methodologies: Granular (for GPs who itemise each capital call) and Gross Up (for GPs using fund-to-investment cash flows). The template applies on a go-forward basis for funds commencing operations on or after 1 January 2026. For funds still in their investment period during Q1 2026, the updated Reporting Template v2.0 replaces the 2016 version. GPs who are currently building reporting infrastructure or selecting new fund accounting systems should design against the 2025 templates as their compliance baseline. The templates also tighten disclosure requirements around fees and expenses, requiring more granular line items for placement fees, subscription facility costs, and portfolio company charges.
+
What is PME and why is it the standard benchmark for private equity performance?
PME stands for Public Market Equivalent, a benchmarking methodology that compares private equity returns against what an LP would have earned had they invested the same capital, on the same schedule, in a public market index. The most widely used institutional approach is Cambridge Associates' modified PME (mPME), which replicates the private fund's cash flow schedule using a public index and calculates the hypothetical return for comparison. A fund with a PME of 1.15 has outperformed the equivalent public market investment by 15%. PME is the most intellectually honest benchmark for PE performance because it controls for the timing of capital deployment — solving the core problem with comparing a private fund's IRR to a public index's annual return. Most institutional LPs expect PME calculations alongside absolute return metrics in quarterly reports, particularly for funds in their harvest phase.
+
What are the most common sources of error in PE portfolio performance reporting?
AI is most useful at the data collection and normalisation stages — reading portco financial documents, extracting structured fields against a consistent schema, and flagging discrepancies for human review. It is not useful for the calculation and judgment stages: IRR and TVPI calculations should use deterministic code (not language model inference), and the narrative interpretation of performance data requires human judgment. In practice, AI agents configured for portfolio performance reporting can ingest portco management accounts in multiple formats, extract revenue, EBITDA, net debt, and fund-specific KPIs, and populate a standardised reporting model — compressing what is typically a two-week data gathering process to one to two days. The critical requirement is visual grounding: every extracted figure must be linked back to its source page in the portco document, so that when an LP queries a number, the GP can provide the audit trail immediately. This traceability also supports ILPA Performance Template compliance, which requires granular, verifiable disclosure at both fund and portfolio company level.
+
How can AI help with portfolio performance reporting without replacing human judgment?
Go is more accurate and robust than calling a model provider directly. By breaking down complex tasks into reasoning steps with Index Knowledge, Go enables LLMs to query your data more accurately than an out of the box API call. Combining this with conditional logic, which can route high sensitivity data to a human review, Go builds robustness into your AI powered workflows.
+
Imogen is an experienced content writer and marketer, specializing in B2B SaaS. She particularly enjoys writing about the impact of technology on sectors like law, finance, and insurance.

