16 min read
—



Casimir Rajnerowicz
Content Creator
V7 Go
A smarter way to manage due diligence and underwriting
The confidential information memorandum (CIM) landed at 4pm. It runs to 84 pages. The partner wants a first-pass view by Thursday, and the model template is already open on the second monitor, waiting.
The formulas in that template are not the problem. They have not changed in a decade. What stands between you and a working leveraged buyout (LBO) analysis is the hour or two you are about to spend finding a revenue figure on page 31, an adjusted EBITDA bridge in an appendix exhibit, a capex line that the banker split across maintenance and growth without saying which is which, and a working capital number that may or may not include the seasonal swing described on page 52.
Every input is somewhere in the document. That is not the same as being available.
Run the arithmetic across a year. A mid-market buyout team building 40 to 50 first-pass models spends somewhere between 60 and 100 hours purely on locating and transcribing numbers out of CIMs. That is two to three working weeks of associate time in which no analysis happens, no thesis is formed, and no deal is advanced. It is the least discussed line item in the deal team's capacity budget, and it is one of the largest.
This guide covers the input-gathering phase specifically: what a first-pass LBO model actually needs, which CIM section each input hides in, and how AI extraction handles the retrieval so an analyst can start with a populated template rather than a blank one.
It deliberately does not cover model construction. If you want the mechanics of what the model calculates once the inputs are in, our guide to the LBO model covers that ground. This article is about the step before it.
In this article:
Why leveraged buyout analysis begins with the CIM, and why the inputs are the bottleneck.
The nine inputs a first-pass LBO model needs, and what each one drives.
A section-by-section map of where those inputs sit inside a CIM.
The five-step AI extraction workflow, and what it does when an input is missing.
Where human oversight stays mandatory, and why.
Why leveraged buyout analysis starts with the CIM
Leveraged buyout analysis is the assessment of whether a company can be acquired using a substantial amount of borrowed money, serviced from the target's own cash flows, and sold on at a return that justifies the equity cheque. Investopedia's definition covers the concept in full if the term is unfamiliar, though most readers of this article will have built the model fifty times.
For a buy-side team, that assessment nearly always begins with one document. The CIM is the sell-side marketing memorandum prepared by the banker running the process, and for the first two or three weeks of a deal it is the only substantive source of information available. Data room access comes later, and only for bidders who make it past the first round. Management presentations come later still.
Which means the first-pass model, the one that decides whether the firm bids at all, is built almost entirely from a document written by someone whose job is to sell the company.
The formulas are standardised, the inputs are not
Every LBO model does the same arithmetic. Sources and uses, a debt schedule with amortisation and a cash sweep, a projection period, an exit assumption, and a returns calculation producing an internal rate of return (IRR) and a multiple on invested capital (MOIC). Any competent associate can build that structure from memory, and most firms have a template that does it already. The standard LBO model structure has been taught the same way for years, which is precisely why it is not where the difficulty sits.
The inputs are where the variability lives. Two analysts handed the same CIM will produce different models, and the difference will almost never be in the formulas. It will be in whether one of them used reported EBITDA and the other used the adjusted figure from the bridge on page 47. It will be in whether the capex assumption included the growth capex the banker described narratively but never tabulated.
This asymmetry is why the input phase deserves more attention than it gets. A model with perfect mechanics and a wrong revenue base is wrong in every cell that follows. Earnings before interest, taxes, depreciation and amortisation (EBITDA) drives the entry valuation, the entry valuation drives the debt quantum, the debt quantum drives the interest expense, and the interest expense drives the free cash flow available for paydown. One bad input at the top compounds through the whole structure and arrives at an IRR that looks precise and is not.
The compounding is worth making concrete. Take a business the CIM presents at £20m adjusted EBITDA, where £1.8m of that comes from add-backs an analyst would question. At an 11x entry multiple, accepting the banker's figure sets enterprise value £19.8m higher than a sceptical read would. At 5.5x leverage that is roughly £10m of additional debt the model assumes the business can carry, servicing costs the business does not generate, and a paydown schedule that will not happen. The IRR still calculates to one decimal place.
Why this phase resists automation by template
Firms have tried to solve this with standardised input sheets, and the sheets help. They do not solve it, because the problem is not that analysts forget which inputs to gather. It is that CIMs are unstructured documents written to a house style that differs by bank, by sector team, and by the seniority of whoever assembled the exhibits.
A CIM from a bulge-bracket sponsor coverage team will have a clean financial appendix with three years of audited figures and a reconciliation of adjustments. A CIM from a regional boutique selling a founder-owned business may present the same information as prose in a section called Financial Highlights, with the adjustments described in a footnote. Template-based extraction breaks on the second document because it was configured against the first.
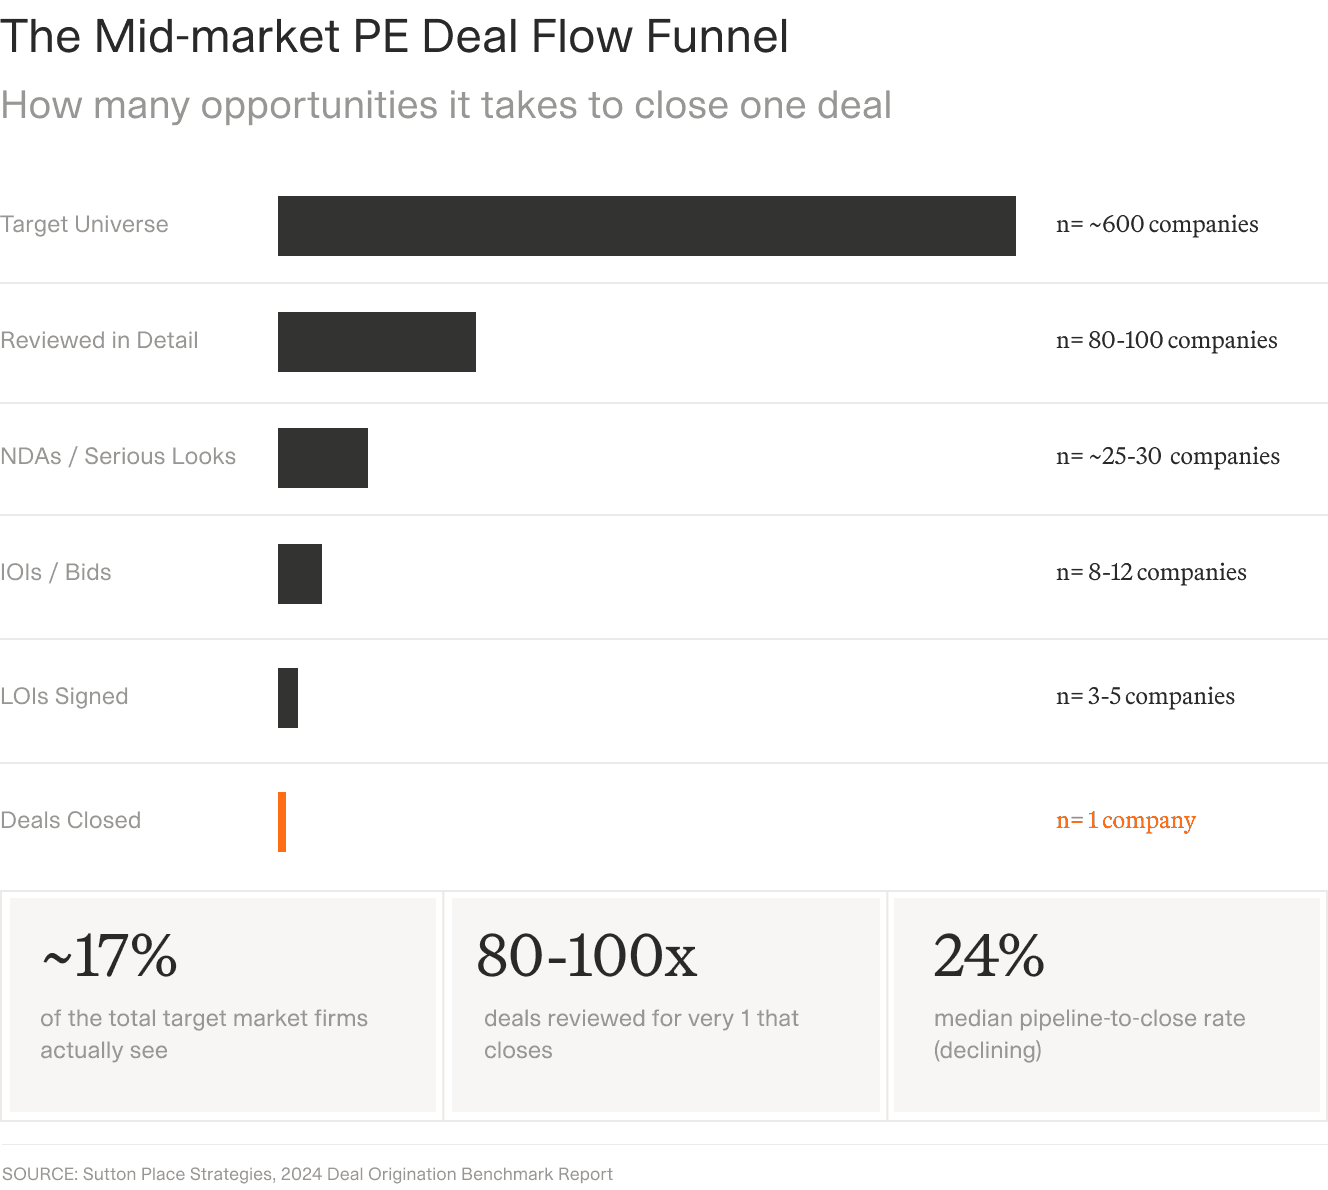
The 80 to 100 detailed reviews per closed deal is the number that makes input-gathering a capacity problem rather than a nuisance. Source: Sutton Place Strategies, 2024 Deal Origination Benchmark Report.
A note on human oversight before going further, because it applies to everything in this article. Nothing described here removes the analyst from the process. Extraction produces a populated template with every figure traceable to its source. Deciding which EBITDA figure is the right one, and whether the banker's adjustments are defensible, remains a judgment call that a competent associate makes and a machine should not.
What a first-pass LBO model actually needs
Nine inputs get a first-pass model to a credible IRR range. Not thirty. Most of the elaboration that separates a first-pass model from a diligence model comes later, once the firm has decided the deal is worth the work.
Here is the working list, and what each input drives downstream.
1. Historical revenue, three to five years. The base for every growth projection and the first sanity check on the banker's narrative. If revenue grew 4% annually for four years and the projections assume 12%, the model needs to know why before it assumes anything.
2. EBITDA and EBITDA margin, reported and adjusted. Both figures matter and they are rarely the same. The entry multiple is applied to one of them, and which one is the single most consequential decision in the input set. Track the bridge between them: add-backs for owner compensation and one-off legal costs are usually defensible, add-backs for pro forma synergies from acquisitions that have not closed are usually not.
3. Capital expenditure, split between maintenance and growth. Maintenance capex is a claim on free cash flow that the business cannot avoid. Growth capex is discretionary and can be dialled down in a downside case. CIMs frequently report a single capex line, and separating it is one of the first questions for the banker.
4. Working capital, and its seasonality. The cash conversion cycle determines how much of reported EBITDA converts to cash available for debt service. A business with a 90-day receivables cycle and inventory build ahead of a seasonal peak has a working capital swing that a full-year average will hide entirely.
5. Existing debt and capital structure. What is being refinanced, what carries prepayment penalties, and whether any of it survives the transaction.
6. Purchase price expectation. Rarely stated outright. Usually inferred from the banker's guidance, the multiple range implied by the comparable companies exhibit, or a process letter.
7. Revenue growth assumptions. Management's projections are the starting point and the least reliable input in the document. Extract them, then discount them.
8. Exit multiple range. Anchored on the entry multiple and the comparable companies exhibit. Most first-pass models assume exit at or slightly below entry, because assuming multiple expansion is how deals get talked into.
9. Management team and key-person exposure. Not a financial input, but it belongs on the list. A founder-led business where the founder is retiring at close carries a risk that shows up as a sensitivity case, not a line item.
Nine inputs. Between them they set the entry valuation, the debt capacity, the cash available for paydown, and the exit assumption, which is the entire return equation.











Where these inputs hide in a CIM, section by section
CIMs follow a broadly consistent structure even when the house styles differ, and knowing which section holds which input is most of the retrieval problem. The mapping below reflects a typical mid-market sell-side memorandum.
CIM section | What it contains | Inputs to extract |
|---|---|---|
Executive summary | Business overview, investment highlights, deal rationale | Revenue scale, ownership context, headline EBITDA, the growth narrative to be tested |
Business overview | Revenue model, customer segmentation, geography, contract structure | Revenue model type, recurring versus transactional split, customer concentration |
Financial summary | Summary profit and loss, EBITDA bridge, headline metrics | Historical revenue, reported and adjusted EBITDA, margin trend |
Management discussion | Forward-looking commentary and projections | Revenue growth assumptions, management EBITDA targets, planned investment |
Market overview | Addressable market, growth rates, competitive position | Industry growth rate for the projection period, competitive intensity |
Risk factors | Identified risks and mitigants | Sensitivity levers, downside case triggers, key-person exposure |
Financial appendix | Detailed profit and loss, balance sheet, cash flow | Capex detail, working capital decomposition, existing debt, seasonality |
Two patterns are worth knowing before trusting that table.
The first is that the same figure often appears in three places and does not always agree. Headline EBITDA in the executive summary is frequently the adjusted number. The financial summary may show reported. The appendix may show both plus a bridge. When they disagree, the disagreement is the finding, and it is exactly what a rushed manual pass misses.
The second is that the appendix carries most of the modelling value and gets the least attention. It is dense, it is late in the document, and it is where capex splits, working capital movements and the true debt position live. An analyst working under time pressure reads the first thirty pages carefully and skims the last twenty.
Why CIM structure varies, and what it means for extraction
Bankers write memoranda for a purpose, and the purpose shapes the format. Understanding that makes the variation predictable rather than annoying.
A broad auction targeting thirty sponsors produces a highly structured document. The banker expects dozens of analysts to work through it in parallel and wants to minimise inbound questions, so the financial appendix is comprehensive and the adjustments are reconciled. A bilateral process or a tightly targeted approach to three known buyers produces something looser, because the banker expects to answer questions directly.
Sector matters too. Software CIMs carry recurring revenue detail, cohort retention and net revenue retention as standard exhibits, because sponsors will ask regardless. Industrial and manufacturing CIMs carry more on capex, capacity utilisation and order backlog. A healthcare CIM will spend pages on payer mix and reimbursement exposure. Each convention determines which of the nine inputs is easy to find and which requires reading.
The practical consequence is that any extraction approach configured against one document type and applied to another will underperform, and it will underperform quietly. This is the argument for a workflow that flags what it could not find rather than one tuned for a single template.
When an input simply is not there
Some CIMs will not contain a maintenance capex split. Some will not disclose working capital movements at all. A minority present three years of revenue and almost nothing else, on the reasonable commercial logic that detail invites questions.
Three responses, in order of preference. Request it from the banker, which costs a day and is usually granted. Estimate from comparable companies and mark the cell as an assumption rather than an extraction. Or model a range wide enough that the missing input does not change the go or no-go decision.
What matters is that the gap is visible. A model where an estimated capex assumption is indistinguishable from an extracted one is a model nobody can audit three weeks later, and the CIM itself is worth understanding as a document type before relying on it. Our guide to CIM review covers what these memoranda include and what they leave out.
How AI automates LBO model input extraction
The retrieval problem has a defined shape: a known set of target fields, a semi-structured source document, and a requirement that every extracted value can be traced back to where it came from. That shape suits a configured extraction workflow well.
Five steps, in sequence.
Ingestion. The CIM is parsed, including the exhibits. Tables in the appendix are read as tables rather than flattened into text, which matters because a profit and loss statement loses its meaning when the column headers detach from the rows.
Section classification. The document is segmented so the workflow knows which part it is reading. An EBITDA figure in the executive summary and an EBITDA figure in the appendix are different claims and get labelled as such.
Structured extraction. Each of the nine input fields is populated from the relevant sections, with a page and section reference attached to every value.
Normalisation and reconciliation. Figures are converted to a consistent basis, and the same metric drawn from different sections is compared. Where the executive summary EBITDA and the appendix EBITDA differ, the workflow surfaces both with the delta rather than silently picking one. This step is arithmetic rather than interpretation, which makes it a good candidate for deterministic code inside the workflow rather than a language model.
Gap flagging. Fields the CIM does not contain are returned empty and marked, not quietly omitted. An empty capex split with a flag is useful. An absent row is a trap.
Source traceability is the part that matters institutionally
Every extracted input carries a link back to the page and section it came from, so verifying the adjusted EBITDA figure means opening the CIM at the bridge exhibit rather than searching an 84-page document for it.
This changes analyst behaviour rather than just saving time. When checking a figure costs thirty seconds, analysts check figures. When it costs five minutes, they check the three that look odd and accept the rest. The second pattern is how a transcription error survives into an investment committee paper.
It also matters after the deal. A model built in March and revisited in September, possibly by someone else, is far more useful when each assumption still points at its origin.
And it matters when the deal progresses. A first-pass model built from the CIM gets rebuilt against the data room once a firm is through to the second round, and the rebuild is where extraction discipline pays a second time. Knowing that the £18.2m EBITDA in the model came from the appendix bridge on page 71 rather than the executive summary headline makes the comparison against audited figures a checking exercise rather than an archaeology exercise.
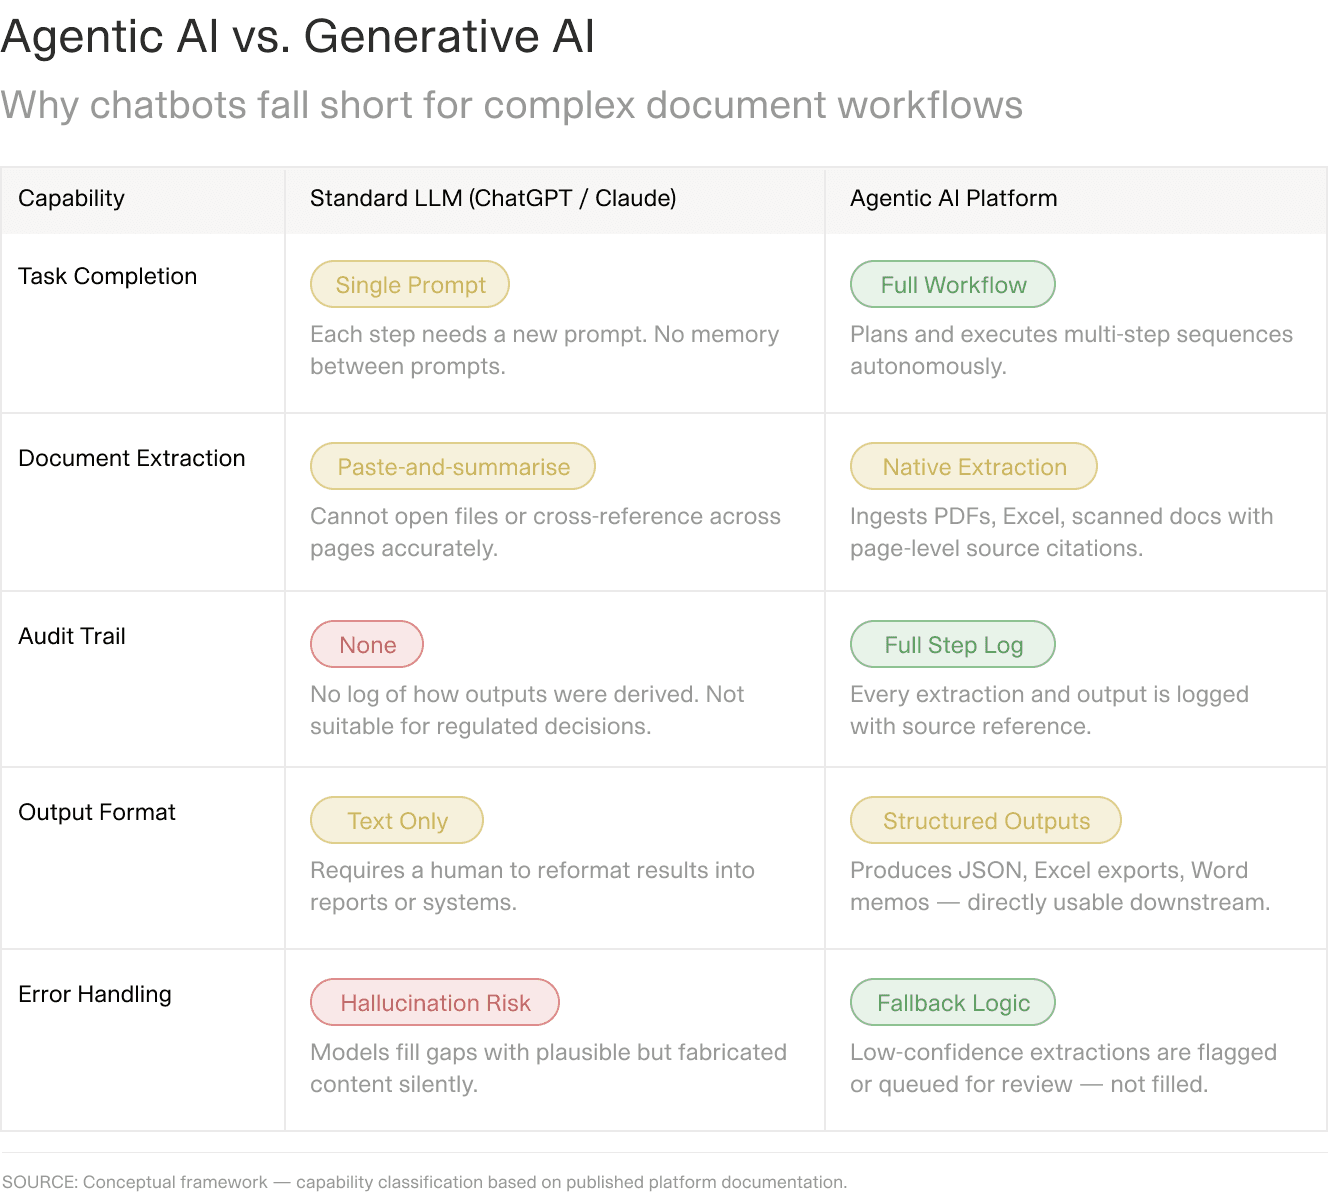
For CIM extraction the columns that matter are output format and audit trail. A summary of a memorandum is interesting. A populated field set with page references is usable.
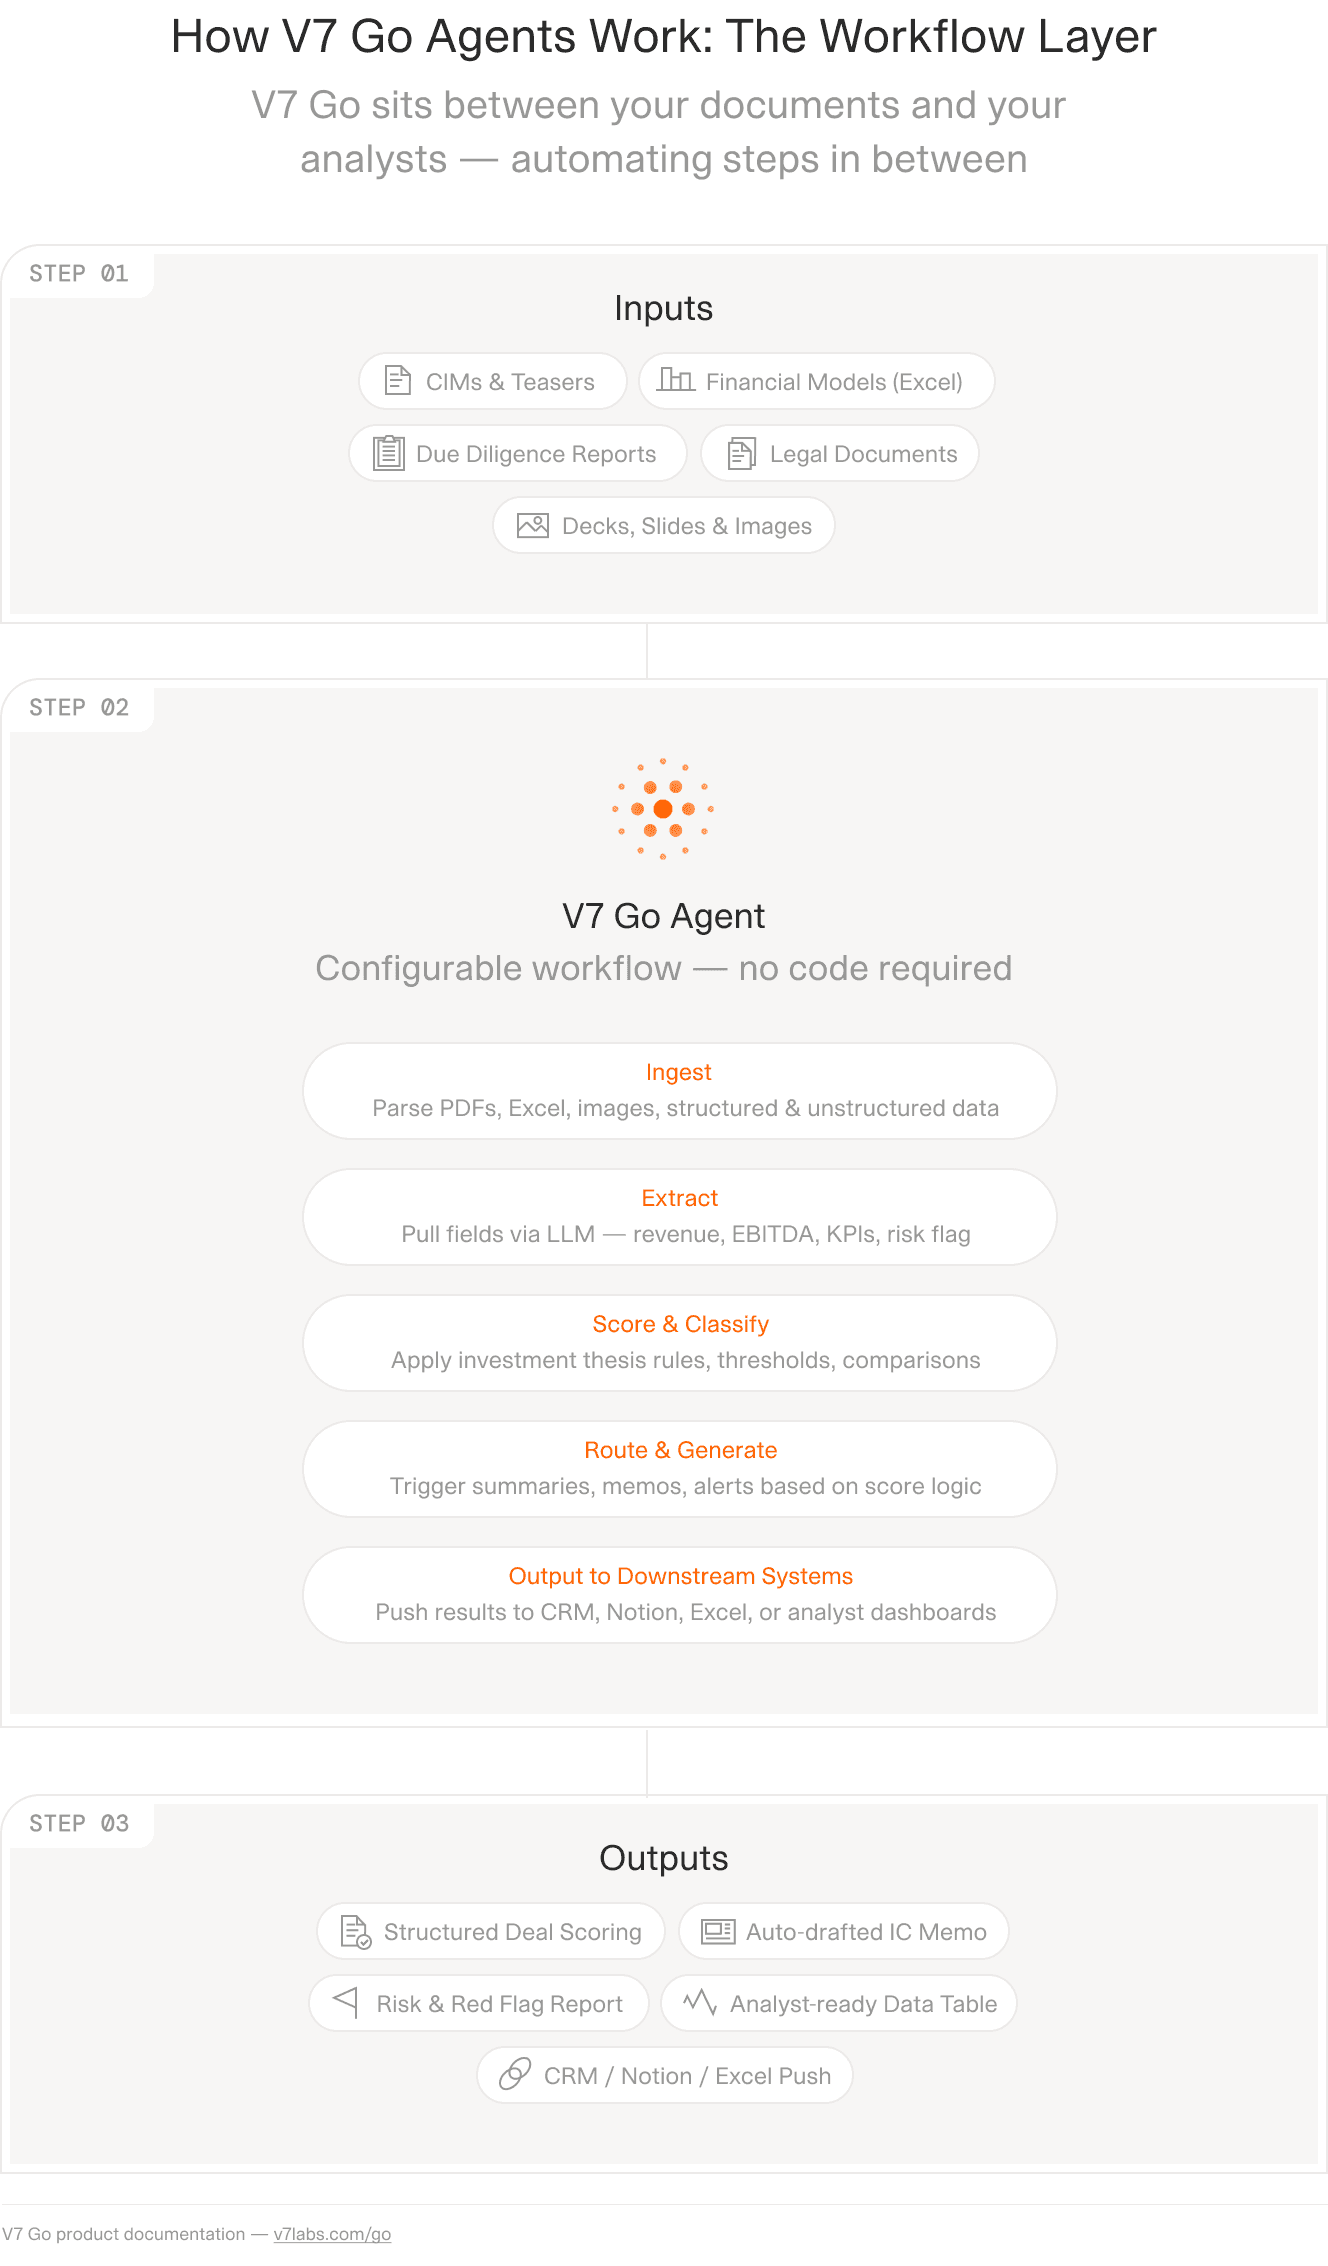
Document in, a defined sequence of extraction steps, structured fields out. The sequence is fixed in advance rather than improvised per document.
What extraction does not do
Accuracy varies with CIM quality, and honest expectations matter here. A memorandum with clean tabular exhibits extracts close to completely. One presenting financials as narrative prose in a founder-owned business sale requires more analyst correction, and the workflow should be expected to flag more uncertainty rather than fewer.
Beyond extraction quality, three judgments stay with the deal team. Whether the banker's add-backs are defensible. Whether management's growth projection is credible given the historical trend. Whether the management team will still be there in eighteen months. None of these are retrieval problems and none of them should be automated.
There is a fourth that is easy to miss. The decision about what a missing input means is itself analytical. A CIM that omits maintenance capex on a capital-intensive manufacturer is a different signal from a CIM that omits it on a software business, and no extraction step can make that distinction. What the workflow can do is make sure the omission is visible rather than papered over with a plausible number.
Running this in practice
This is the kind of workflow V7 Go was built for. The LBO model creation agent ingests the CIM, maps its sections, and populates a defined field set with a source reference on every value, so the analyst opens a partially completed template rather than a blank one alongside a PDF.
Two implementation details matter more than the headline.
The field set is yours. Firms model differently: some split capex three ways, some carry a separate line for run-rate synergies, some want customer concentration as a numeric field rather than a note. Because the schema is defined once and applied to every CIM, the fortieth deal of the year arrives structured the same way as the first, which is what makes deals comparable across a pipeline rather than only individually assessable.
The output goes where the model already lives. Extracted inputs flow into the Excel template the team already uses, into a screening view for pipeline triage, or onward through an API into whatever the firm uses for deal tracking. The financial model builder agent handles the downstream population step, and LBO model preparation covers the full workflow.
The realistic gain is not that a model gets built faster. It is that the input phase stops consuming the hours that should have gone into judging the deal, and that a team screening 80 CIMs a year can give the fortieth the same attention it gave the fourth. What happens after the model is built is a separate workflow, covered in our guide to turning a CIM into an investment memo.
Where the time actually goes back
The case for compressing the input phase is not that models get built faster. Model construction was never the slow part.
It is that the ratio changes. An associate spending 90 minutes extracting and 30 minutes thinking is inverting the value of their own time, and they know it. Reverse that ratio and the same person spends their afternoon interrogating the banker's add-backs, stress-testing the growth assumption against the historical trend, and forming a view on whether the working capital swing is structural or a one-off. That is the work the firm is paying for.
There is a throughput argument alongside it, and for most mid-market funds it is the larger one. A team that can only build 40 first-pass models a year is declining deals on the basis of capacity rather than merit. Some of those declines are correct. Some of them are a good business that arrived in a busy week.
Preqin's 2026 private equity outlook describes a market where capital continues concentrating and competition for quality assets remains intense. In that environment the number of opportunities a team can properly assess is a competitive variable, not an operational detail.
There is a quieter benefit that only appears after a year of doing this consistently. A fund that has extracted the same field set from 200 CIMs has, without setting out to, built a proprietary dataset on its own market: entry multiples by sub-sector, how consistently bankers in a given sector overstate growth, which advisers present clean financials and which do not. None of that exists for a firm whose screening output is 200 differently shaped spreadsheets on 200 different associates' drives. V7's AI workflows for finance teams are built around that accumulation rather than the single-document win.
What to do on the next CIM
Start by writing down the field list. Not software, just the nine or twelve inputs your first-pass model actually needs, agreed across the team. Most funds discover during this exercise that two associates have been treating adjusted EBITDA differently for a year.
Then time yourself on the next CIM. Separate the minutes spent locating and transcribing from the minutes spent thinking. Most people are surprised by the split, and the number is the business case.
Keep the judgment where it is. The add-backs, the growth assumption, the management assessment, the decision to bid. Those are the reasons the associate is in the seat. The retrieval is not.
If you want to see extraction run against a CIM from a live process rather than a demo document, V7's solutions engineers build a working version against your own field list first. Book a working session and bring the last memorandum that cost you an afternoon.
What inputs do you need for an LBO model?
A first-pass leveraged buyout model needs nine inputs. Historical revenue across three to five years gives you the base for growth projections. EBITDA and EBITDA margin, both reported and adjusted, anchor the entry valuation. Capital expenditure split between maintenance and growth determines how much cash flow is genuinely available for debt service. Working capital and its seasonality set the cash conversion cycle. Existing debt and capital structure tell you what is being refinanced. Purchase price expectation, usually inferred from banker guidance or the comparable companies exhibit, sets the entry point. Revenue growth assumptions come from management projections and should be discounted. Exit multiple range is normally anchored at or slightly below entry. Finally, management team and key-person exposure is not a financial input but belongs in the sensitivity cases.
+
How long does it take to build an LBO model?
A complete first-pass leveraged buyout model typically takes six to ten hours, and the split between phases surprises people. Extracting inputs from the confidential information memorandum accounts for one to two hours of that, sometimes more when the memorandum presents financials as narrative rather than tables. Actual model construction is faster than most assume, because the formula structure is standardised and most firms work from a template. The remaining time goes into sensitivity cases, sanity checks and the write-up. Automated extraction compresses the input-gathering phase from one to two hours down to minutes, which does not make the model appreciably faster to build. What it changes is how much of the total is spent on analysis rather than transcription.
+
Can AI automate LBO modeling?
AI reliably automates the input extraction phase and the population of a model template. It does not automate model construction logic or the judgment calls the analysis depends on. The distinction is worth being precise about. Retrieval tasks, locating a revenue figure in an appendix exhibit, reconciling an EBITDA number that appears differently in three sections, converting tables into a consistent format, are well suited to a configured extraction workflow because the target fields are known in advance. Decisions about which adjusted EBITDA figure is defensible, whether management growth projections are credible, and what exit multiple to underwrite are not retrieval problems. Human oversight of flagged and uncertain values remains mandatory before any extracted figure feeds an investment decision.
+
What financial data is in a CIM?
A confidential information memorandum typically contains historical profit and loss data covering three to five years, an EBITDA bridge showing adjustments from reported to adjusted figures, capital expenditure, working capital movements, and existing debt. Beyond the financials it carries management projections, market growth data, customer segmentation, and a risk factors section. Depth varies considerably. A memorandum prepared by a bulge-bracket sponsor coverage team usually includes a detailed financial appendix with reconciliations. One prepared by a regional boutique for a founder-owned business may present the same information as prose with adjustments described in footnotes. Not every memorandum discloses a maintenance and growth capital expenditure split, and many omit working capital seasonality entirely, which is why gap flagging matters.
+
What is the difference between LBO analysis and LBO modeling?
Accuracy depends heavily on how the memorandum is structured, and any honest answer has to say so. Documents with clean tabular financial exhibits extract close to completely, because the target figures sit in labelled tables with consistent headers. Documents presenting financials as narrative prose require substantially more analyst correction, and a well-configured workflow should respond by flagging more uncertainty rather than producing confident values. The more useful question is not the headline accuracy rate but whether the system tells you which values to check. Extraction that returns a source reference on every field, marks low-confidence values, and leaves genuinely absent inputs empty rather than inferring them is auditable. A plausible-looking table with no provenance is not, regardless of how accurate it happens to be.
+
How accurate is AI extraction from a CIM?
Go is more accurate and robust than calling a model provider directly. By breaking down complex tasks into reasoning steps with Index Knowledge, Go enables LLMs to query your data more accurately than an out of the box API call. Combining this with conditional logic, which can route high sensitivity data to a human review, Go builds robustness into your AI powered workflows.
