Document processing
20 min read
—


Tired of drowning in SEC filings? Learn how to read a 10-K report and 10-Q with AI, extracting critical financial data like revenue and net income in minutes, not days.

Let’s be blunt: trying to understand how to read a 10-K report manually is an exercise in patience-testing, eye-glazing, data drudgery. These annual SEC filings, along with their quarterly 10-Q siblings, are treasure troves of company information—critical for investors, financial analysts, and strategists. But they’re also monstrously long and dense.
Want to know what does a 10-K tell you? Everything. And that’s the problem.
The old way of 10-K report analysis is a Herculean task. Analysts can spend days, if not weeks, meticulously sifting through information, a process that is not only time-consuming but also fraught with the potential for human error. Overlooking a critical risk factor or misinterpreting a footnote in the financial statements can have significant consequences. This manual grind is susceptible to errors of omission, original entry, principle, and commission, leading to flawed insights and delayed decisions.
But what if there was a smarter way? Enter Artificial Intelligence. Specifically, Generative AI platforms like V7 Go are fundamentally changing how financial reports like 10-K and 10-Q forms are analyzed with AI. Imagine turning those hundreds of pages into structured, actionable insights in minutes.
This guide is your map. We’ll break down 10-K and 10-Q reports, explain their vital role, and then show you how generative AI is making the mastery of these SEC filings faster and more insightful. We’ll cover:
The core differences between 10-K and 10-Q reports.
Why understanding these SEC filings is non-negotiable for smart decisions.
A practical tour of key 10-K sections—your roadmap to finding crucial information like revenue, net income, and risk factors.
The value of 10-Q reports for timely quarterly updates.
The brutal realities and time-sinks of manual analysis.
How AI, especially generative AI, crushes these challenges.
An in-depth look at software capabilities for automating 10-K and 10-Q document analysis.
Actionable tips for integrating AI into your financial report review.
A glimpse into the future of analyzing financial reports.

Chat with your files and knowledge hubs
Expert AI agents that understand your work
Get started today
Decoding SEC Filings: 10-K vs. 10-Q
Before diving into the nitty-gritty of analyzing, let’s establish what these foundational documents are. Both the 10-K and 10-Q are filed with the U.S. Securities and Exchange Commission (SEC), providing crucial transparency into public companies, but they serve different tempos in the rhythm of financial reporting.
The 10-K Report: Your Annual Encyclopedia
The Form 10-K is the big one—a company’s comprehensive annual report—a deep, detailed dive into a company’s business, financial condition, and operational results for its entire fiscal year. Think of it as the company’s most thorough annual check-up, complete with lab results. Companies must file it within 60 to 90 days of their fiscal year-end. The real weight behind the 10-K comes from its audited financial statements. This audit, conducted by independent accountants, provides a significant level of assurance regarding the accuracy of the financial data presented—from revenue and net income to the details buried in the cash flow statement and balance sheet (including assets, liabilities, and equity). It’s often more exhaustive than the annual report mailed to shareholders.
The 10-Q Report: The Quarterly Finger on the Pulse
If the 10-K is the encyclopedia, the Form 10-Q is the executive summary update. It’s a quarterly report providing a more frequent, though less detailed, snapshot of a company’s recent performance and financials. Filed for the first three fiscal quarters (the fourth is wrapped into the 10-K), it’s typically submitted within 40 or 45 days of the quarter’s end. Critically, the financial statements in a 10-Q are usually unaudited. For those wondering, “what is a 10-Q?” or “what does a 10-Q tell you?”, it’s your best source for timely, interim financial insights between the big annual disclosures, revealing recent earnings trends and shifts in financial health.
In the video above, you can see how an AI platform (V7 Go) extracts and summarizes information from a bundle of 10-Q forms. All AI outputs include hyperlinks for visual verification, taking you to the exact location in the documents that each insight is based on.
Key Differences: 10-K vs. 10-Q Unpacked
Understanding these distinctions is fundamental to knowing what information to expect and how to approach your 10-K report analysis or 10-Q review.
Feature | 10-K Report | 10-Q Report |
|---|---|---|
Frequency | Annually | Quarterly (for Q1, Q2, Q3) |
Audit Status of Financials | Audited Financial Statements | Usually Unaudited |
Scope of Information | Comprehensive, full fiscal year overview | Focused update on recent quarter |
Level of Detail | Highly detailed description of business and operations | Condensed, highlights material changes |
Typical Length | Hundreds of pages | Significantly shorter |
Why You Can’t Afford to Skip These Reports: The Bedrock of Smart Decisions
Let’s be frank: if you’re making financial or business decisions without dissecting these reports, you’re flying blind. These documents are not just regulatory formalities; they are the bedrock of informed analysis.
For Investors: This is where you separate hype from reality. 10-Ks and 10-Qs provide the raw data to assess investment viability, scrutinize risks, and evaluate a company’s genuine growth potential against its actual earnings and stock price performance.
For Financial Analysts: These filings are the lifeblood. Building robust financial models, making credible recommendations, and conducting meticulous due diligence all hinge on the detailed financial data and narrative found within these filings.
For Business Professionals: Want to understand your competitors? Industry trends? Potential partners? 10-Ks and 10-Qs offer a transparent look into the operations, strategies, challenges, and performance of public companies, offering invaluable competitive intelligence.
What does a company’s annual report tell you? It tells you the official story. The consequences of not understanding these reports can range from poor investment choices and flawed financial models to missed competitive advantages and disastrous strategic missteps.
How to Read a 10-K Report: Key Sections Unpacked
So, you’ve got a 10-K in front of you. How is 10-K written and structured? It’s divided into four main parts. Here’s a quick guide to the most important items—think of this as your treasure map.
Part I: The Company’s Story and Its Perils
This part gives you the lay of the land—what the company does and the major risks it faces.
Item 1: Business: This is your starting point for understanding the company. It’s a detailed description of its operations, principal products and services, competitive landscape, and the regulatory environment. You’ll find insights into the company’s strategy for generating revenue here.
Item 1A: Risk Factors: Absolutely critical reading. This section lists the most significant risks and uncertainties that could materially affect the company’s business, financial condition, or operating results. Effective 10k risk factors analysis is paramount for investors. Look for specific, quantifiable risks, not just boilerplate warnings. AI tools can be particularly helpful in tracking changes to this section over time.
Item 1B: Unresolved Staff Comments: Details any outstanding written comments from SEC staff regarding the company’s prior filings.
Item 2: Properties: Information about the company’s significant physical properties, like manufacturing plants or corporate headquarters.
Item 3: Legal Proceedings: Describes any significant pending lawsuits or other legal actions involving the company.
Part II: Financial Performance
This is where you find the hard financial data and the management's interpretation of it. It answers: “What are the 4 components of an annual report’s financial heart?”—typically Balance Sheet, Income Statement, Cash Flow Statement, and Notes.
Item 5: Market for Registrant’s Common Equity, Related Stockholder Matters and Issuer Purchases of Equity Securities: Information about the company’s common stock, including trading markets, dividend history, and any recent stock repurchases by the company.
Item 7: Management’s Discussion and Analysis of Financial Condition and Results of Operations (MD&A): This is management’s narrative explanation of the financial statements. It’s where they discuss trends in revenue and expenses, the reasons for significant changes in financial results, their assessment of liquidity and capital resources, and their outlook for the future. A critical read for context.
Item 7A: Quantitative and Qualitative Disclosures About Market Risk: Provides details about the company’s exposure to market risks, such as interest rate risk, foreign currency exchange risk, or commodity price risk.
Item 8: Financial Statements and Supplementary Data: The core financials. This includes the audited financial statements: The Balance Sheet (a snapshot of assets, liabilities, and shareholders’ equity at a point in time); the Income Statement (showing revenue, cost of goods sold, operating expenses, operating income, interest, tax, net income, and earnings per share over a period); and the Cash Flow Statement (detailing cash inflows and outflows from operating, investing, and financing activities). Crucially, this section also contains the Notes to Financial Statements, which provide detailed explanations of accounting policies and further breakdowns of the numbers. Learning how to read financial statements in 10k, especially these notes, is a vital skill. You will typically not find revenue on a balance sheet. It’s a core component of the Income Statement.
Item 9 & 9A: Changes in and Disagreements with Accountants & Controls and Procedures: Discloses issues with accountants and discusses internal controls over financial reporting.
Part III: Governance and Compensation
This part focuses on the people running the company and how they are governed and compensated.
Item 10: Directors, Executive Officers and Corporate Governance: Background information on the company’s directors and top executives (including the CEO), and details about its corporate governance practices.
Item 11: Executive Compensation: This section provides a detailed breakdown of the compensation for the company’s top executives. A must-read for understanding incentives.
Item 12 & 13: Security Ownership & Certain Relationships: Discloses who owns significant chunks of the company’s stock and any transactions between the company and insiders.
Part IV: Exhibits and Signatures
Item 15: Exhibits, Financial Statement Schedules: A list of all other documents filed as part of the 10-K, like material contracts. The actual exhibits are often attached here.
AI, particularly tools like V7 Go, can automatically extract key takeaways and data points from each of these sections, transforming your 10K review from a data hunt into strategic information gathering. And if you’re wondering “how do you read a 10-K SEC filing efficiently?”, structuring your approach around these parts, augmented by AI, is the answer.


The 10-Q Report - What to Look For
The 10-Q is the nimble companion to the 10-K’s exhaustive detail. Filed quarterly, it’s designed to keep investors and analysts informed of a company’s performance throughout the year. So, what does a 10-Q tell you? It provides a snapshot of recent financial performance, highlights significant developments since the last full annual report, and updates key risk factors. It’s usually unaudited, making it a quicker, but less definitive, read than the 10-K.
When you examine a 10-Q, what you look for generally boils down to:
Condensed Financial Statements: These are the core of the 10-Q. You’ll find an abbreviated Income Statement, Balance Sheet, and Cash Flow Statement. Focus on comparing these to prior quarters and the same quarter in the previous year to spot trends in revenue, net income, expenses, and earnings per share.
Management’s Discussion and Analysis (MD&A): Similar to the 10-K, but focused on the quarter. This section provides management’s commentary on the financial results, explaining significant variances and discussing material changes in the business.
Updates to Risk Factors: Companies must disclose any new material risks or significant changes to previously identified risks. This is a crucial area to monitor for emerging challenges.
Legal Proceedings: Updates on any significant legal actions.
The 10-Q is your tool for continuous monitoring. AI can supercharge this by automatically flagging significant QoQ or YoY changes in financial data or highlighting new risk factor language, making your quarterly review far more efficient.
Learn more:
The Painful Reality of Manual Analysis: Why Your Eyes Glaze Over Reading 10-Ks
If reading SEC filings manually were easy, you wouldn’t need this guide. The truth is, it’s a demanding task.
How long should it take to read a 10-K?
The question has a painful answer for many: far too long. This is due to several inherent hurdles:
The sheer density and complexity of a 10-K make manual review a high-stakes tightrope walk, where a missed detail in financial data can lead to flawed investment decisions.
Information Overload: A typical 10-K is a tome, hundreds of pages thick. Sifting through this to find the critical nuggets of financial data or narrative is like finding a needle in a haystack.
The Time Sink: Analysts spend an inordinate amount of time on this, detracting from actual analysis. How many components of an annual report can one truly absorb manually under pressure?
The Labyrinth of Complexity: Financial jargon, legalese, convoluted footnotes, and varying presentation styles across companies create a steep learning curve and high cognitive load.
The Peril of Omission: Human attention wanes. It’s dangerously easy to skim over a subtly rephrased risk factor or a new disclosure in a footnote that could have major implications for the company’s stock price.
The Comparison Quagmire: Manually tracking trends or comparing data across multiple reports or companies is an error-prone nightmare of data entry and reconciliation. Simple tasks like tracking revenue or debt consistently become herculean. For example, trying to find where revenue on a balance sheet might be mentioned (hint: it's on the income statement) across varied report formats demands intense focus.
These challenges, well-documented by platforms focused on automating 10-Q analysis, highlight why AI is becoming a game-changer for anyone needing to understand how to read a financial report efficiently.
AI for SEC Filings Analysis
Artificial Intelligence, particularly advancements in Natural Language Processing (NLP), Machine Learning (ML), and Generative AI, offers a powerful antidote to the pain of manual report analysis. AI tools bring a new level of precision and depth to analyzing these critical company documents.
Automated, Pinpoint Data Extraction: AI can dive into the text and pull out specific financial figures (revenue, net income, operating income, debt, assets, equity), qualitative statements, and even data from complex tables within the financial statements. As Redress Compliance notes, AI can identify patterns and correlations that human analysts might easily miss. This is key when you need to know how do you read 1000 financial statements (i.e., statements reported in thousands).
Intelligent Summarization: Forget highlighter pens. Generative AI can produce concise, human-readable summaries of lengthy sections like MD&A or Risk Factors, surfacing the key takeaways instantly.
Trend and Anomaly Detection: AI algorithms can sift through historical and current financial data to identify significant trends, flag anomalies, or highlight emerging risks discussed in the narrative. This helps in analyzing an annual report for deeper meaning.
Sentiment Analysis: Beyond numbers, NLP can gauge the tone and sentiment of management's discussions in the MD&A, providing qualitative insights into their outlook and confidence.
Effortless Comparative Analysis: AI effortlessly tracks changes across multiple reports, automatically calculating QoQ and YoY changes for critical metrics, and even benchmark against peer company filings.
This AI-driven approach doesn’t just make a 10K review faster but also makes it smarter and more comprehensive.
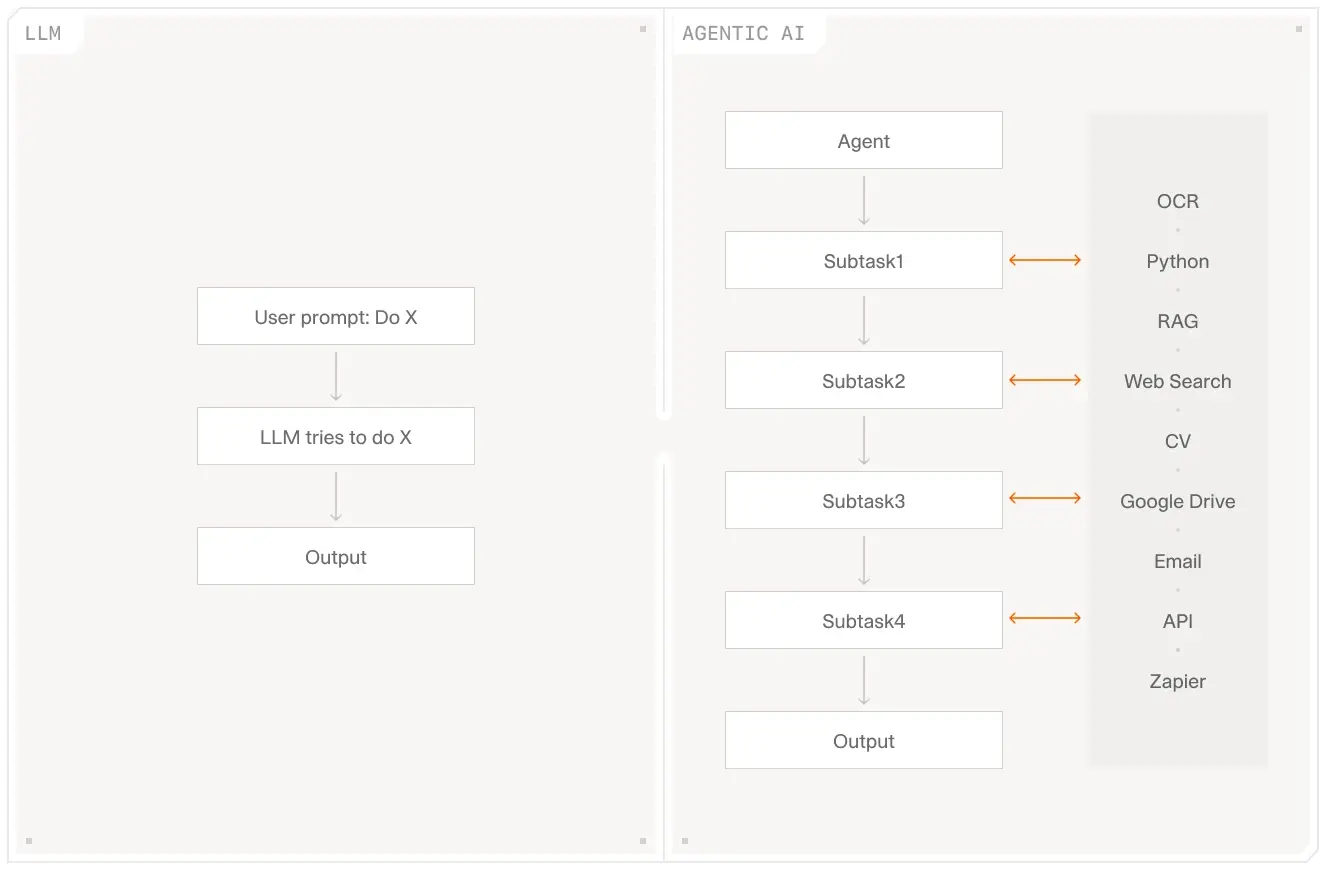
Traditional Large Language Model (LLM) workflows versus the more sophisticated multi-step AI agentic architecture employed by platforms like V7 Go for comprehensive 10-K and 10-Q report analysis, integrating multiple data sources and analytical tools.
V7 Go: Your AI Co-Pilot for Mastering SEC Filings
V7 Go is a Generative AI document automation platform engineered for the precise and deep analysis of complex documents like SEC 10-K and 10-Q reports. It’s designed to be like an analytical partner that truly understands how to read a 10k report from an AI’s perspective.
Smart Classification and AI Agent Deployment
When you upload a PDF, V7 Go’s intelligence kicks in immediately. It automatically identifies whether it’s a 10-K, 10-Q, or another type of financial report. This classification triggers a specialized V7 Go AI Agent. With a library of over 40 such agents, each is fine-tuned for the specific structure and nuances of that particular document type, ensuring the most relevant analytical tools are applied from the very beginning.
Granular Data Extraction
V7 Go’s AI agents perform granular data extraction with remarkable accuracy. Imagine analyzing Walmart’s Q2 2021 10-Q; V7 Go can precisely extract:
Income Statement Data: It would identify “Total Revenues” as $141,048 million, compare it to the prior year’s $137,742 million, and instantly calculate the +2.4% YoY change. Similarly, “Consolidated Net Income” ($4,364 million vs. $6,439 million YoY, -32.2%) is accurately pulled from the income statement.
Balance Sheet Items: It captures “Total Assets” at $238,552 million, “Cash and cash equivalents” at $22,831 million, and “Long-term debt” at $39,581 million from the balance sheet, tracking changes against previous periods.
Key Performance Indicators (KPIs): For a company like Airbnb (Q3 2021), it extracts “Nights and Experiences Booked” at 79.7 million (a +29% YoY surge) and “Gross Booking Value (GBV)” at $11.9 billion (+48% YoY).
Non-GAAP Financials: It accurately extracts adjusted figures like Airbnb’s “Adjusted EBITDA” of $1,101.3 million and “Free Cash Flow” of $517.7 million.
Segment Performance: For a multi-segment company like Walmart, it can break down “Net sales” by division: Walmart U.S. ($98.2B), Walmart International ($23.0B), and Sam’s Club ($18.6B), including their respective operating income. This answers “where can I find my 10-K income statement breakdown by segment?”—V7 Go does it for you.
Crucially, V7 Go backs every piece of extracted data with AI Citations. This means each number is hyperlinked directly to its exact location in the source document—total transparency and easy verification. This is fundamental for knowing how is 10-K written for data accessibility and understanding the key figures like revenue or depreciation.
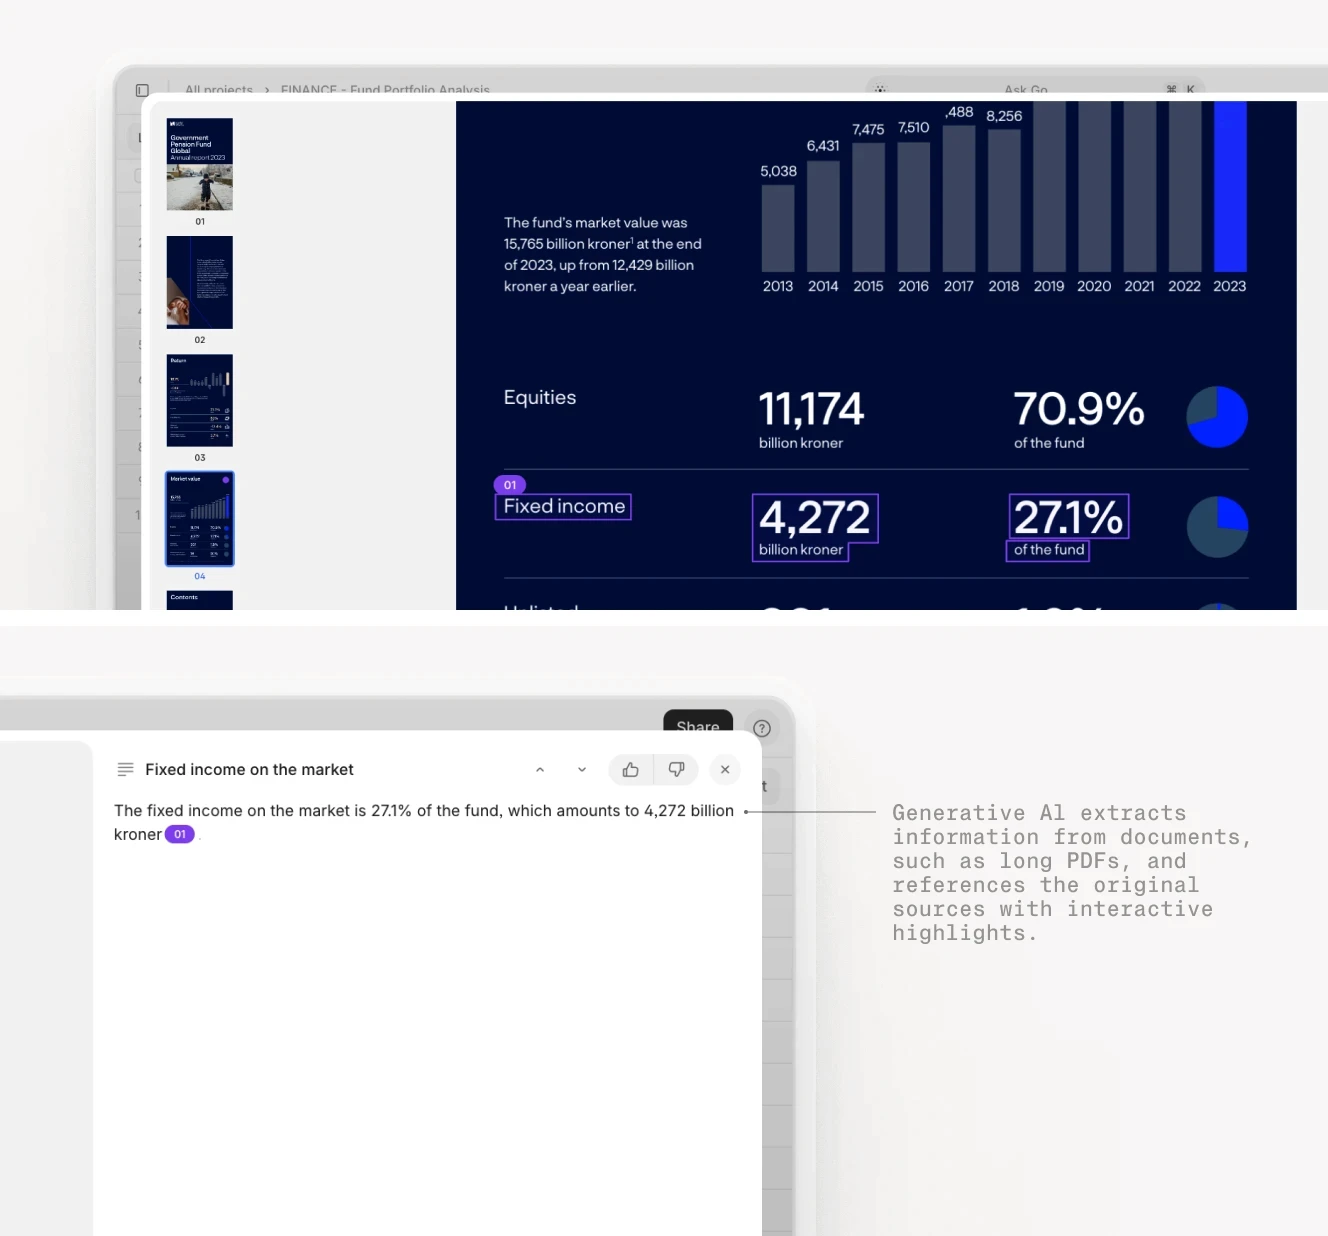
V7 Go’s AI Citations offer unparalleled transparency, visually grounding every extracted financial data point from a 10-K or 10-Q back to its precise source in the document.
Beyond Numbers: AI-Driven Summaries and Synthesis
V7 Go transforms raw data into understanding. It can generate insightful, human-readable summaries for any SEC filing. For Airbnb’s Q3 10-Q, it could produce an “Executive Summary” noting: “$2.24B revenue (+67% YoY) driven by strong travel recovery; Net Income $833.9M. Gross Booking Value up 48%.” It can also draft an “Investment Thesis” section, pulling together disparate pieces of information into a coherent analytical viewpoint regarding the company’s stock price and future earnings potential, effectively summarizing what a company’s annual report tell you in a strategic context.
Structured Outputs for Seamless Workflows
All this rich, extracted information (revenue, net income, earnings per share, debt levels, operating income, etc.) and the AI-generated summaries can be easily exported (e.g., as CSVs). This allows for seamless integration into your existing financial models or custom AI workflows, turning static SEC filings into dynamic analytical assets. This directly impacts how do you analyze an annual report—making it far more data-driven.
Practical Tips: Your AI-Augmented Approach to 10-K/10-Q Reports
AI is a powerful ally in 10-K report analysis, but it’s most effective when guided by human intelligence. Here’s how to combine the best of both worlds:
Set Your Compass: What answers are you seeking from this report? Are you focused on risk assessment (Item 1A), growth drivers (MD&A), profitability (Income Statement), or financial health (Balance Sheet)? Your objective dictates your AI queries and your human focus.
Let AI Chart the Initial Course: Start with V7 Go’s AI-generated “Executive Summary” and summaries of key sections like MD&A and Risk Factors. This provides a quick, intelligent overview and helps you prioritize areas for your deeper dive.
Harness AI-Extracted Financials: Instead of manually inputting numbers, use the structured financial data extracted by V7 Go (revenue, expenses, net income, cash flow figures, etc.) directly in your models. Always use the AI Citations to verify critical or unusual figures against the source document, especially for items like depreciation or tax expenses.
Probe the Notes to Financial Statements: This is often where the real story lies. AI can help navigate these dense notes, but your expertise is vital to interpret accounting policies, off-balance sheet items, or contingent liabilities that could impact future earnings.
Critically Evaluate the AI’s “Investment Thesis”: Use V7 Go’s AI-generated thesis as a well-researched starting point, then challenge its assumptions, and enrich it with your industry knowledge and qualitative judgment about the company’s management (like the CEO and their executive compensation) and market position.
By leveraging AI, you can transform the daunting task of analyzing SEC filings from a battle against information overload into a focused quest for insight, truly understanding how financial analysts can be augmented, not replaced.
The Future: AI and Financial Report Analysis
The world of financial analysis is on the cusp of major changes. AI is a foundational shift and we’re looking at a future where:
AI Understands Deeper Context: AI models will become even more adept at interpreting the nuances of financial language, management tone in the MD&A, and the implications of complex legal clauses or footnotes in the financial statements.
Predictive Power Grows: AI will increasingly use the wealth of data in 10-K and 10-Q reports not just for historical analysis but to generate more accurate forecasts of company performance, earnings per share, and even potential stock price movements.
Seamless Integration of AI Tools: AI-driven analysis capabilities will become standard features within financial platforms, making them an almost invisible yet indispensable part of an analyst’s daily routine. Referencing the insights from our AI Agents Guide, these tools will act as intelligent assistants.
The Analyst Evolves: The role of the financial analyst will shift from data archaeologist to strategic interpreter, using AI-generated insights as a launchpad for higher-level thinking.
The growth statistics are compelling: the generative AI in finance market is expected to soar from $1.29 billion in 2024 to $21.57 billion by 2034. The majority of financial institutions already use AI and are planning to increase AI spending.
Turning SEC Data Dumps into Decisive Strategic Insights
The 10-K annual report and quarterly 10-Q filings are the lifeblood of informed financial decision-making. They tell the detailed story of a company’s performance, its financial health, its strategies, and its risks. But, historically, extracting that story from these dense SEC documents has been a formidable challenge—a time-consuming, error-prone endeavor that often feels like wrestling with data rather than deriving wisdom from it.
Artificial intelligence, particularly advanced Generative AI platforms like V7 Go, is definitively changing this narrative. What does a 10-K tell you when viewed through the lens of AI? It reveals its secrets far more readily. By automating data extraction, generating insightful summaries of key sections like the MD&A and Risk Factors, identifying critical trends in revenue and net income, and enabling sophisticated comparative analysis, AI transforms the arduous task of 10-K report analysis into an efficient, strategic, and deeply insightful process.
The benefits are not just about speed. Complex financial information—from the intricacies of a cash flow statement to the details of executive compensation—becomes more accessible, more structured, and ultimately more actionable. This empowers investors, analysts, and business leaders to make smarter, faster decisions based on a truly comprehensive understanding of a company’s position and prospects. The future of financial analysis is not a battle between human and machine, but a powerful synergy. It’s about augmenting human expertise with the unparalleled processing power of AI. Embrace these advancements to turn the data dump of SEC filings into a wellspring of decisive insights.
See how V7 Go can deconstruct your next 10-K or 10-Q report. Request a demo and explore V7 Go’s capabilities for Generative AI in Finance.

What is the main difference between a 10-K and a 10-Q report, and how does AI handle both?
The primary difference is that the 10-K is a comprehensive annual report providing audited financial statements and a detailed overview of a company’s entire fiscal year, including its business operations and risk factors. The 10-Q is a less detailed, quarterly report providing unaudited financials, offering timely updates. AI, like V7 Go, can process both, adapting its analysis to the differing levels of detail, extracting key financial data, and summarizing relevant sections appropriately for each report type.
+
Why is the MD&A section so important for understanding a 10-K or 10-Q?
The Management’s Discussion and Analysis (MD&A) section is vital because it’s management’s narrative explaining the financial statements. It discusses trends in revenue and expenses, reasons for significant changes, liquidity, capital resources, and the company’s outlook. This provides crucial context that the raw numbers in the income statement or balance sheet alone don’t offer.
+
How can AI assist in analyzing the ‘Risk Factors’ section (Item 1A) of a 10-K report?
AI can quickly scan and analyze the often lengthy ‘Risk Factors’ section. It can identify newly disclosed risks, highlight changes in the wording or emphasis of existing risks compared to previous filings, and summarize the most critical threats facing the company. This allows analysts and investors to rapidly assess potential vulnerabilities and integrate them into their overall company assessment, making 10-K report analysis more efficient.
+
What are the four main parts of a 10-K annual report that an analyst should examine?
A 10-K report is broadly divided into: Part I (Business Overview, Risk Factors, Legal Proceedings), Part II (Financial Data including MD&A, Income Statement, Balance Sheet, Cash Flow Statement, and Notes), Part III (Corporate Governance, Executive Compensation, Major Shareholders), and Part IV (Exhibits and Financial Statement Schedules). Each part offers different but crucial insights into the company’s operations and financial health.
+
Where can I find revenue on a 10-K, and how can AI help extract this financial data?
Manually reading and thoroughly analyzing a 10-K report can take an experienced analyst several hours to multiple days, depending on the company’s size and complexity, and the depth of review needed. AI significantly reduces this time. AI tools can perform initial data extraction, summarization of key sections, and flag material changes in minutes, allowing analysts to focus their valuable time on interpretation and strategic thinking rather than laborious data gathering.
+
How long should it typically take to read a 10-K, and can AI significantly reduce this time?
Go is more accurate and robust than calling a model provider directly. By breaking down complex tasks into reasoning steps with Index Knowledge, Go enables LLMs to query your data more accurately than an out of the box API call. Combining this with conditional logic, which can route high sensitivity data to a human review, Go builds robustness into your AI powered workflows.
+
Casimir is a seasoned tech journalist and content creator specializing in AI implementation and new technologies. His expertise lies in LLM orchestration, chatbots, generative AI applications, and computer vision.

