12 min read
—



Casimir Rajnerowicz
Content Creator
V7 Go
A smarter way to manage due diligence and underwriting
A fund fact sheet is a two to four page summary that an asset manager publishes for each fund, usually monthly, covering performance by period, risk statistics, portfolio composition, fees and a short piece of manager commentary. Fund selectors use them as the running record of what every fund under coverage is actually doing.
Which is fine until you are covering two hundred of them.
A research team running a 200-fund universe receives somewhere between 50 and 200 fact sheets a quarter, each from a different asset manager, each laid out differently. Reviewing one properly takes 20 to 45 minutes: open the PDF, find the performance table, type the period returns into the model, find the risk section, type the volatility and the Sharpe ratio, note anything the manager said about positioning, close it, open the next one. At a hundred funds that is 33 to 75 analyst hours per cycle, and none of it produces a view on anything.
The bottleneck in fund selection is not analysis. It is data collection.
This is a solvable problem, and it has become solvable fairly recently. Fact sheets defeated a decade of template-based automation for a specific reason worth understanding before evaluating any tool: they are designed for human eyes rather than machine parsing, and every fund house designs them differently.
This guide covers what a fact sheet contains, why the format resists conventional extraction, how model-based extraction handles it, and where the boundary sits between what a machine should read and what an analyst still has to judge.
In this article:
What a fund fact sheet contains, field by field, and how often it is published.
Why the same data in a different layout breaks template-based extraction.
The six-step extraction workflow, and what a real configuration looks like.
What can be extracted reliably, and what cannot.
Production-side versus consumption-side automation, and why the distinction matters when buying.
What a fund fact sheet contains
Fact sheets carry six categories of information, and the categories are consistent across the industry even though the presentation is not.
Performance. Returns by period, typically one month, three months, six months, year to date, one year, three years, five years and since inception, shown against a benchmark. Some managers add calendar year returns as a separate table.
Risk statistics. Annualised volatility, Sharpe ratio, Sortino ratio, maximum drawdown, beta, tracking error and information ratio. Coverage varies more here than anywhere else on the document.
Fund characteristics. Assets under management, number of holdings, active share, price to earnings, yield, and for fixed income, duration and credit quality.
Portfolio construction. Top ten holdings with weights, geographic allocation, sector allocation. Usually presented as a table on one side and a chart on the other, sometimes as a chart only.
Costs. Ongoing charges figure or total expense ratio, entry and exit loads where they apply, performance fee terms, and increasingly a note on swing pricing.
Metadata and commentary. ISIN, SEDOL, manager name and tenure, domicile, base currency, inception date, dealing frequency, and one to four paragraphs of manager narrative on market conditions and positioning.
Regulatory context, and what it does not standardise
Fact sheets sit alongside a regulated disclosure document rather than being one themselves, and the distinction causes recurring confusion.
In Europe, the Key Information Document (KID) required under the PRIIPs regulation is a prescribed format with prescribed content, replacing the older Key Investor Information Document (KIID) for most retail products. Its layout is fixed by regulation, and the European Commission's delegated acts specify the content down to the ordering of sections. The fact sheet is not. It is a marketing and reporting document that the manager designs, which is precisely why a KID can be parsed with a template and a fact sheet cannot.
Publication is usually monthly, with data as at the last business day of the month and release around ten working days later. Some managers publish quarterly for institutional share classes. For a selector, this means the extraction problem recurs on a monthly cycle rather than being a one-off migration.
Why format variability is the whole problem
Every asset manager uses its own template, and the differences are not cosmetic.
The same figure is labelled Net Return by one house, Performance by another, and Total Return Net of Fees by a third. The performance table sits on page one in some templates and page three in others. One manager gives sector allocation as a table with percentages, the next gives a pie chart with no underlying numbers printed. Footnotes qualify figures that appear two pages earlier. Share class matters and is sometimes indicated only in a header, so a fund with eight share classes produces eight fact sheets that differ in fees and returns while looking nearly identical.
A human reads around all of this without noticing. That is what the document was designed for.
Some of the variability is not accidental. Fund houses treat fact sheet design as brand territory, and the presentation of performance is a competitive decision as much as a disclosure one. Industry bodies including EFAMA have pushed for greater comparability in retail fund disclosure across Europe, and the regulated documents have converged accordingly. The fact sheet, sitting outside that perimeter, has not.
Why OCR and template-based automation fall short
Most fund research teams have tried to automate this at least once, and the attempt usually failed in one of three ways.
Optical character recognition extracts text but discards structure. A performance table spanning two columns becomes a sequence of disconnected numbers, and the association between the figure 12.3 and the label three-year annualised is exactly what OCR loses. The output is technically machine-readable and practically useless.
Template-based tools work by coordinates: the figure at this position on this page is the one-year return. They are accurate until the fund house redesigns its template, which happens without notice and usually at the start of a year. A library of fifty templates requires fifty maintenance relationships nobody owns.
Rule-based extraction sits between the two and inherits the weaknesses of both. Rules that look for a label and read the adjacent cell work well until a manager uses a different label, merges cells, or puts the figure in a chart.
The common failure is the same in each case. These approaches operate on where a value sits rather than on what it means, and fact sheet layouts are the one thing that is guaranteed to change.
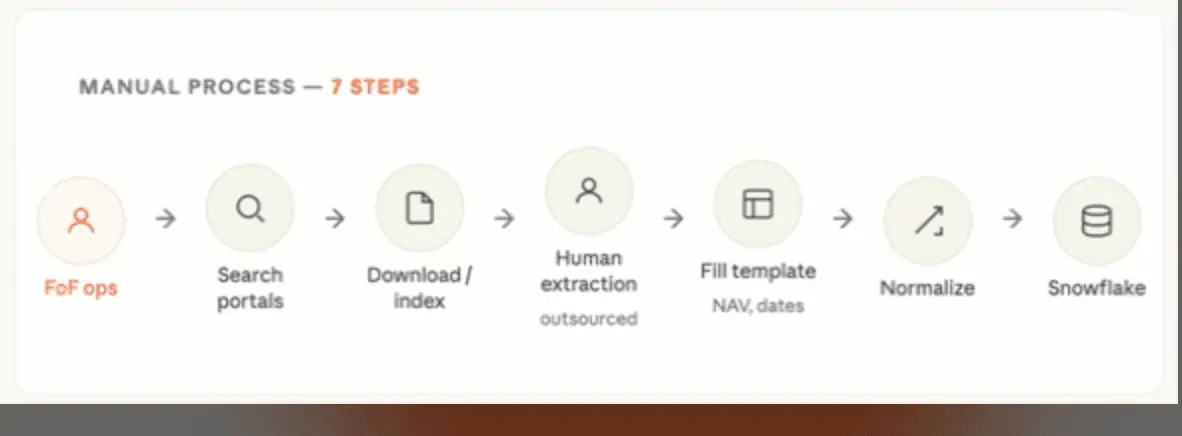
The manual version of the same job, drawn out step by step. Note where the human sits: at extraction and at normalisation, which are the two steps that scale with the number of fund houses rather than the number of funds.











How AI automates fund fact sheet processing
Model-based extraction changes the basis of the problem. Instead of asking where the one-year return sits on the page, it asks which figure on this page is the one-year return, which is a question that survives a redesign.
Six steps, in sequence.
1. Batch intake. A folder of fact sheets goes in as received. Mixed fund houses, mixed layouts, mixed share classes, no pre-sorting and no conversion step.
2. Structure recognition. Each document is segmented so the workflow knows which region it is reading. The performance table, the risk block, the allocation charts, the fee table and the commentary are identified as distinct areas before any figure is pulled.
3. Field extraction. Each target field is populated with its label and period attached. The output records the one-year net return for the period ending 31 March for a named share class, rather than a bare figure of 12.3.
4. Confidence scoring. Every value carries a confidence score. Low-confidence extractions are flagged rather than passed through silently, which is the single most important property of the whole workflow.
5. Structured output. The results flow into the systems the team already uses: the research database, the peer group model, the platform where comparison actually happens.
6. Source tracing. Each value links back to the location in the source PDF, so verifying a figure means opening the document at the right table rather than searching it.

The same six steps as a pipeline rather than a list. Step four is the one that decides whether the output is reviewable: a document that fails a check routes to a person instead of continuing quietly.
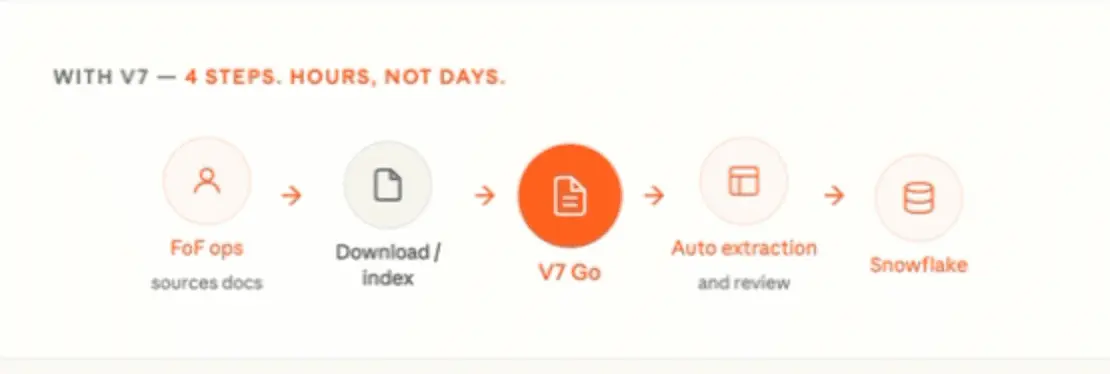
The same pipeline with the extraction and normalisation steps configured once rather than repeated per document. The destination does not change, which is the point: the research database, the peer group model and the warehouse all expect what they already expected.
What a real configuration looks like
Abstract workflows are easy to agree with, so it is worth looking at an actual one. V7 Go ships a fund fact sheet extractor as a template, and its field list is a reasonable model for what a research team should be capturing.
It defines 26 extracted fields. The identifiers cover fund name, ticker, CUSIP, inception date and benchmark index. The numeric fields cover total assets, expense ratio, portfolio turnover, cash position, five-year alpha and five-year standard deviation. Four of the fields are collections rather than single values, which matters more than it sounds: top ten holdings, sector allocation, the performance table and calendar year returns each come back as a structured table rather than as a blob of text, so a holding and its weight stay associated.
Three fields are classifications rather than extractions. Fund classification, benchmark tracking and a risk factors multi-select are derived by the workflow from what it read, not copied from the document. And three are short written analyses: a performance summary, a concentration analysis and a benchmark tracking assessment.
The detail worth noticing is that different fields run on different models. Most of the identifier and numeric extraction runs on Claude Sonnet 4.5. The classification and narrative fields run on Gemini. That is not indecision. Extraction and judgment are different tasks, and a workflow that lets you choose per field will beat one that applies a single model to everything.
Underneath the model choice sits a plainer principle: the parts of this job that are arithmetic should not be inference at all. Checking that sector weights sum to 100, that the performance table periods are consistent with the report date, or that the expense ratio falls in a plausible range are deterministic checks. Running them as code rather than as a prompt makes them repeatable and free to re-run.
What extracts reliably, and what does not
Reliable, in rough order of confidence: fund metadata and identifiers, period returns and benchmark returns, expense ratios and fee terms, top holdings with weights, sector and geographic allocation where a table exists, and the standard risk statistics.
Manager commentary extracts as text without difficulty, though what a team wants from it is usually a theme or a change of tone rather than the paragraph itself, and that is a second processing step rather than an extraction.
Two things do not work and should be treated as boundaries rather than gaps. Allocation presented only as an unlabelled chart, with no underlying figures printed anywhere on the page, cannot be read reliably; the honest response is a flagged empty field, not an estimate from pixel widths. And a fact sheet is a static point-in-time document, so nothing in it is a substitute for a live pricing feed.

Sector allocation and portfolio metrics held as fields rather than read off a page. Once a hundred fact sheets have been through the same field set, allocation becomes something you can sort a universe by.
The compounding benefit nobody buys it for
Teams buy this to save the 33 to 75 hours. What they notice a year later is different.
A universe of 200 funds extracted to the same field set every month is a time series. It supports questions that were previously impractical: which managers have drifted from their stated sector exposure over four quarters, which have seen expense ratios move, whose commentary changed tone before performance did. None of that is available from a folder of PDFs, however well organised, because the data was never structured in the first place.
This is the same argument as the Context Graph: the value of processing a document properly lies in what accumulates once every document has been read the same way, rather than in clearing it off the desk. For a fund research team, the accumulated asset is a queryable history of its own coverage universe.
Production-side and consumption-side automation are different products
The market conflates two things that sound identical and are not, and this catches out buyers who evaluate the wrong category.
Production-side automation is what an asset manager buys. The problem is generating several hundred fact sheets a month from internal performance systems, in brand-compliant layouts, across share classes and languages, on a deadline. Tools in this space pull from a data warehouse and output PDFs. The engineering problem is templating and throughput.
Consumption-side automation is what a fund selector, wealth manager or research team buys. The problem is reading several hundred fact sheets that arrived from third parties in layouts nobody controls. The engineering problem is extraction accuracy under format variability.
Most vendors in this niche do the first. V7 Go does the second.
The practical test when evaluating: ask whether the tool takes documents in or puts documents out. If a demo starts with connecting to your performance database, it is a production tool. If it starts with uploading a folder of other people's PDFs, it is a consumption tool. Both are legitimate; they are almost never bought by the same person.
Where this sits in a fund research workflow
Fact sheet extraction is one input to fund selection rather than the whole of it, and it is worth being clear about the boundary.
Extraction gives a research team a current, structured, comparable dataset across its coverage universe without anyone re-keying it. What the team does with that is the actual work: peer group construction, identifying which funds warrant a manager call, assessing whether a strategy still does what it claimed. Those are judgments and they stay with the analyst.
For allocators the same document pipeline extends further. Fact sheets sit alongside quarterly capital account statements, due diligence questionnaires and operational due diligence packs, and the extraction pattern is the same in each case. Our guide to private equity fund due diligence covers the diligence end, and fund performance analysis and fund document processing cover the automation side. Teams building a broader document capability may also want our overview of intelligent document processing.
How to evaluate a fact sheet extraction tool
Four questions separate tools that work at volume from tools that demo well.
What happens on an unfamiliar layout? Ask the vendor to run a fact sheet from a manager they have never seen, and preferably an awkward one: a boutique with a two-column layout and allocation shown only as a chart. A tool configured per template will not tell you it failed. It will return a confident value from the wrong cell.
Can you see where each figure came from? Source tracing is the difference between an output you can check in seconds and one you have to re-verify. For anything feeding a client-facing peer group comparison, that is not a preference.
What does it do when a field is absent? Not every fact sheet reports a Sortino ratio. The correct behaviour is an empty flagged field. The dangerous behaviour is a calculated approximation presented identically to an extracted value.
Can you define the field set? A fixed schema someone else designed will be missing the three fields your process depends on. The field list should be yours, and it should be changeable without a support ticket.
Start with one month of one universe
The sensible pilot is narrow and it is cheap to run.
Take one month of fact sheets for a coverage universe you already maintain by hand, ideally 30 to 50 documents across a realistic spread of fund houses. Run them through extraction and compare against the spreadsheet the team produced manually for the same month. That comparison answers the accuracy question with your documents rather than a vendor's, and it takes an afternoon.
Two things usually emerge from it. The first is that extraction is more accurate than expected on the standard fields and less accurate than hoped on whichever field your particular universe presents unusually. The second is that the manual spreadsheet contains two or three errors nobody had noticed, which is an uncomfortable but useful finding.
Keep the analyst review. Fund selection decisions get defended to investment committees and clients, and a number nobody checked is a number nobody should cite. What changes is that review means checking flagged items against a source that opens at the right page, rather than re-reading two hundred PDFs to find the three that were wrong.
If it would help to see extraction run against your own fact sheet library rather than a sample pack, V7's solutions engineers configure the field set with you before any commitment. Book a working session and bring last month's folder, including the fund house whose layout everyone complains about.
What is a fund fact sheet?
A fund fact sheet is a two to four page summary document that an asset manager publishes for each fund, typically monthly, giving the key performance, risk and portfolio information for that fund. It covers returns across standard periods against a benchmark, risk statistics such as volatility and the Sharpe ratio, portfolio characteristics including assets under management and number of holdings, the top ten holdings with weights, sector and geographic allocation, fees, and a short section of manager commentary. Fund selectors, wealth managers and research teams use fact sheets as the running record of what every fund under coverage is doing. It is distinct from a regulated disclosure document such as a Key Information Document, whose format is prescribed. The fact sheet layout is designed by the manager, which is why no two look alike.
+
What does a fund fact sheet contain?
Six categories of information. Performance covers returns for one month, three months, six months, year to date, one year, three years, five years and since inception, usually shown against a benchmark. Risk statistics cover annualised volatility, Sharpe ratio, Sortino ratio, maximum drawdown, beta, tracking error and information ratio, though coverage varies by manager. Fund characteristics include assets under management, number of holdings, active share and yield. Portfolio construction covers the top ten holdings with weights plus sector and geographic allocation. Costs cover the ongoing charges figure or total expense ratio, any entry and exit loads, and performance fee terms. Metadata and commentary cover the ISIN, manager name and tenure, domicile, base currency, inception date, and one to four paragraphs of manager narrative.
+
How often is a fund fact sheet updated?
Monthly is the standard across most of the industry, with data as at the last business day of the month and publication roughly ten working days later. Some managers publish quarterly for institutional share classes or for funds where holdings turn over slowly. Private market funds report quarterly as a rule rather than monthly. The publication cycle matters operationally more than most teams expect, because it means processing fact sheets is a recurring monthly workload rather than a one-time data migration. A research team covering 200 funds receives a fresh set every month, and the extraction problem returns each cycle in full. That recurrence is what makes manual review expensive over a year, and what makes automation worth configuring properly rather than approximately.
+
What is the difference between a fund fact sheet and a prospectus?
A fact sheet is a short summary of how a fund is performing and what it currently holds. A prospectus is the full legal offering document setting out the terms of the fund: investment objective and restrictions, complete risk disclosures, fee structures, dealing and redemption terms, and the legal obligations of the manager. The fact sheet runs to two to four pages and is updated monthly. The prospectus runs to tens or hundreds of pages and is updated rarely, usually only when terms change materially. The practical distinction for a research team is that a fact sheet tells you what happened last month while a prospectus tells you what the manager is permitted to do. Diligence needs both, and they are read at different points in the process.
+
Can AI extract data from fund fact sheets?
Fund identifiers and metadata extract most reliably: name, ticker, ISIN or CUSIP, inception date, benchmark index, domicile and base currency. Numeric fields follow: total assets, expense ratio, portfolio turnover, cash position, alpha and standard deviation. Tabular data extracts as structured collections rather than text, which keeps a holding associated with its weight: top ten holdings, sector allocation, the full performance table and calendar year returns. Manager commentary extracts as text for separate theme or sentiment analysis. Two limits are worth stating. Allocation presented only as an unlabelled chart, with no figures printed anywhere on the page, cannot be read reliably and should return a flagged empty field rather than an estimate. And a fact sheet is a point-in-time document, so it is never a substitute for a live pricing feed.
+
What data can be extracted from a fund fact sheet automatically?
Go is more accurate and robust than calling a model provider directly. By breaking down complex tasks into reasoning steps with Index Knowledge, Go enables LLMs to query your data more accurately than an out of the box API call. Combining this with conditional logic, which can route high sensitivity data to a human review, Go builds robustness into your AI powered workflows.
