5 min read
—


Which AI tools actually move the EBITDA needle for private equity operating partners, and in what sequence should you deploy them.

Private equity operating partners are under more pressure than ever to demonstrate measurable value creation between deal close and exit. Boards expect margin improvement. LPs track EBITDA progression. The firms winning on returns are deploying AI not as a future initiative, but as a live operational tool during the hold period.
This guide covers the AI tools PE operating partners are using today, the functions where they move the EBITDA needle, and a practical deployment sequence for a standard 3–5 year hold.
The EBITDA impact map by function: pricing, procurement, customer ops, RevOps, F&A, and supply chain
A curated tools list with verified use cases for each category
A hold period deployment framework: what to implement first, and when
Concrete EBITDA improvement estimates benchmarked against mid-market portfolios

AI for document processing
Deploy AI agents that actually move EBITDA metrics
Get started today
Why AI Has Moved from Experiment to Mandate in PE
Three years ago, PE operating partners were fielding questions about AI from portco management teams. Today the direction has reversed. Operating partners are arriving at portfolio companies with AI implementation plans built into the value creation roadmap from day one.
The shift is evidence-driven. A 2024 FTI Consulting survey of PE-backed companies found that 67% of portfolio businesses had deployed at least one AI or automation tool at an operational level, up from 22% in 2022. Firms reporting structured AI programmes delivered 1.4× higher revenue growth than the sector median.
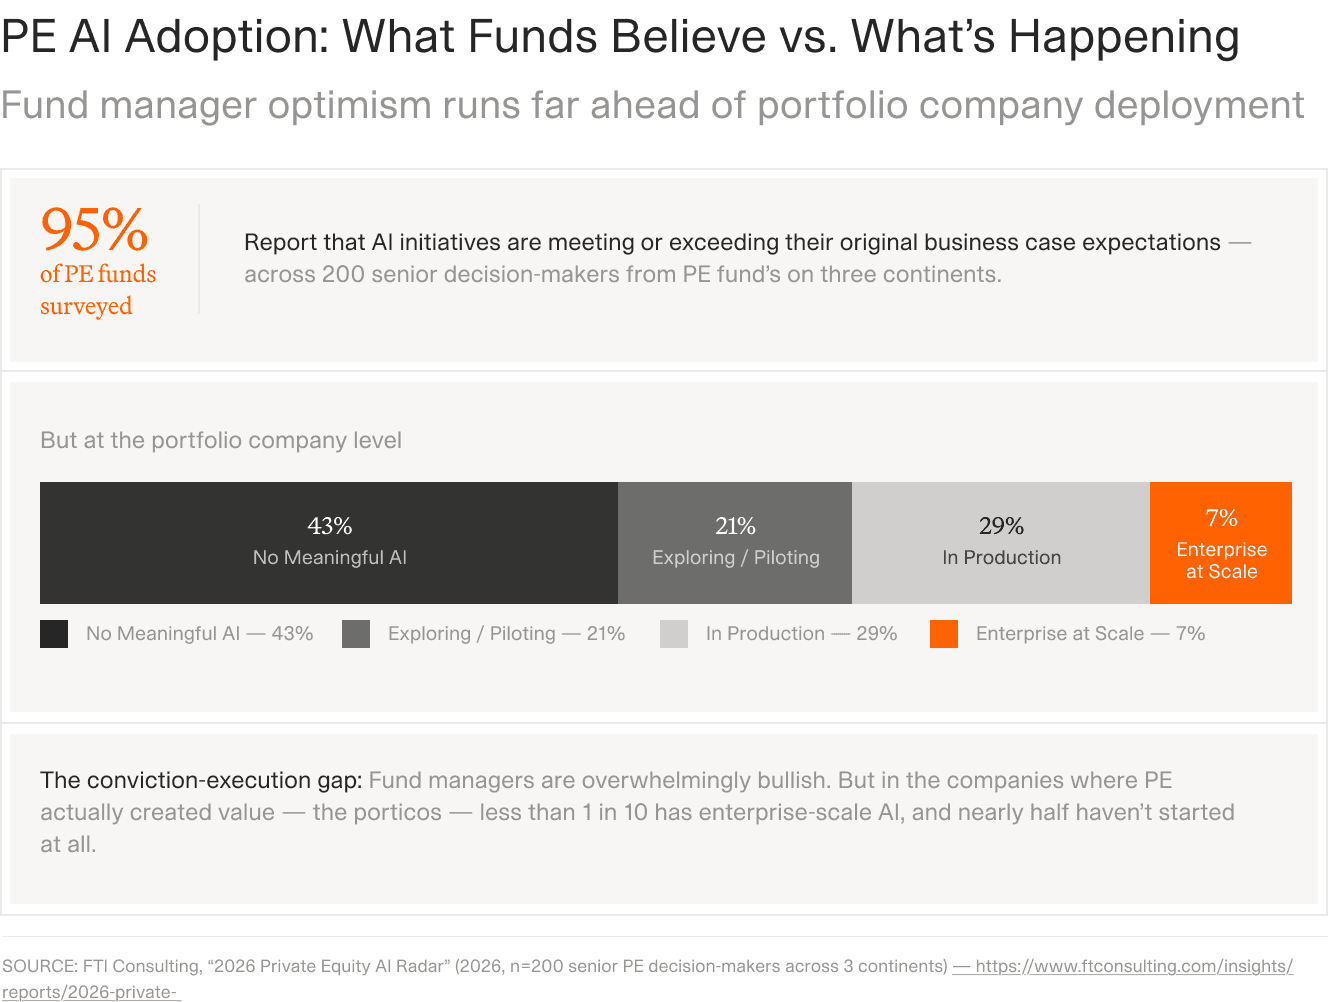
AI adoption in PE-backed portfolio companies has accelerated sharply since 2022. Source: FTI Consulting, 2024.
Operating partners have three structural advantages in driving AI adoption that internal management teams typically lack: cross-portfolio pattern recognition, a mandate to act fast, and access to pre-vetted vendor shortlists. These advantages compound. An operating partner who has deployed a pricing optimisation tool across three portcos brings deployment certainty that a first-time CFO cannot replicate. For a look at how AI fits into deal workflows for PE firms and the accuracy benchmarks behind it, the data is worth reviewing before tool selection.
The question is no longer whether AI belongs in the value creation plan. It is which tools, in which sequence, produce the most reliable EBITDA impact.
Where Operating Partners Focus
Across V7 Go deployments in PE-backed mid-market businesses, operating partners are concentrating AI investment in four areas: pricing and commercial strategy, procurement and spend analytics, F&A process automation, and customer operations efficiency. Each maps directly to an EBITDA lever with a measurable impact timeline.
The most effective operating partners treat AI deployment as a sequenced programme rather than a point-solution rollout. The data layer comes first. Without structured, normalised financial data from across the portfolio, analytics and automation tools lack the inputs they need to produce insight. For a closer look at how this works in practice, see our guide to AI-powered portfolio monitoring.


The EBITDA Impact Map: What AI Actually Moves
Not all AI tools deliver EBITDA impact equally. The table below summarises the six operational functions where AI has demonstrated consistent, measurable returns in PE-backed mid-market businesses, along with typical impact ranges.
Function | AI Application | Typical EBITDA Impact |
|---|---|---|
Pricing | Dynamic pricing, price realisation analysis | +3–5% EBITDA margin |
Procurement | Spend analytics, contract intelligence, supplier consolidation | 2–4% cost reduction |
Customer Ops | AI support, churn prediction, retention workflows | 1–3% EBITDA margin |
RevOps | Pipeline forecasting, deal scoring, sales productivity | 5–15% revenue growth |
F&A | Invoice automation, reconciliation, financial close | ~25% process cost reduction |
Supply Chain | Demand forecasting, inventory optimisation | 2–5% working capital improvement |
Pricing: The Fastest Route to Margin
Pricing intelligence tools analyse transaction data, competitor pricing signals, and customer segmentation to identify where a portco is leaving margin on the table. In distribution and manufacturing businesses, pricing AI typically surfaces 3–5 percentage points of recoverable margin within the first 90 days of deployment.
The leading tools in this category include Pricefx for CPQ and price management, and Vendavo for B2B pricing optimisation. Both integrate with major ERP systems and can be deployed without significant infrastructure changes.
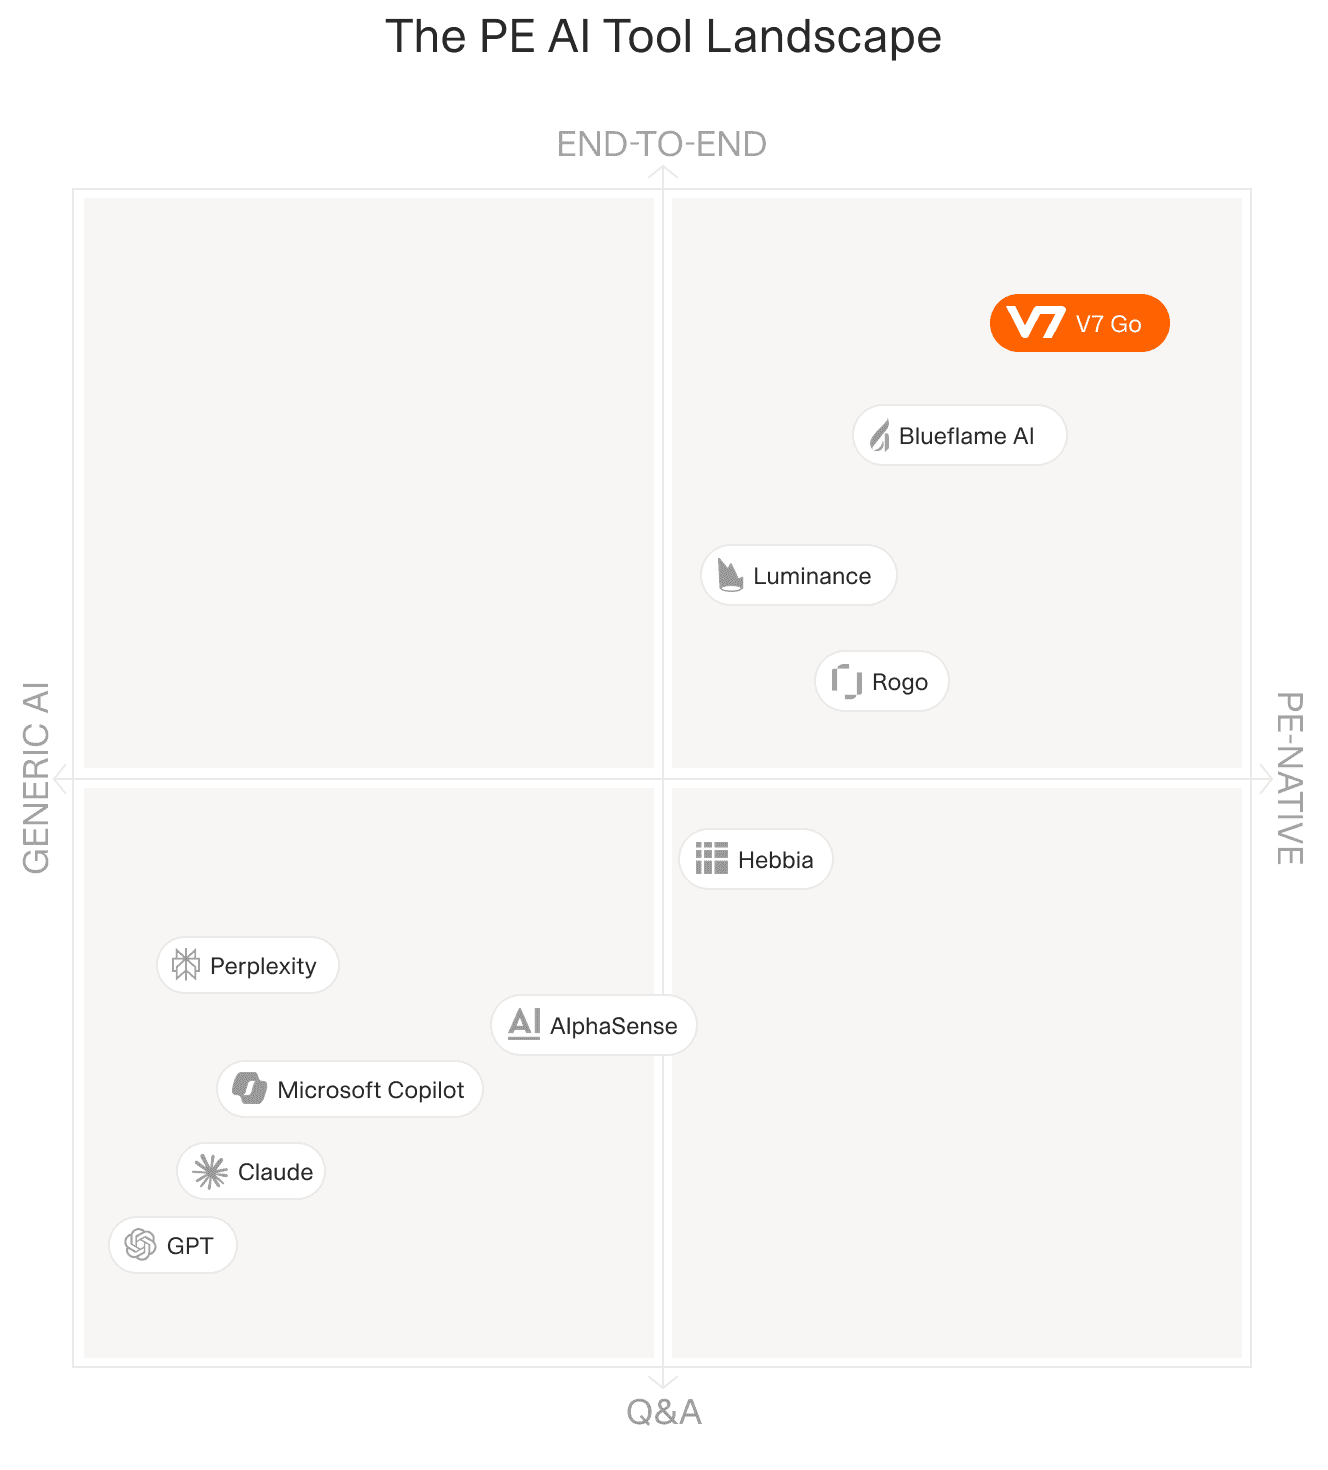
The PE AI tools landscape mapped by operational function and EBITDA lever.
Procurement: Contract Intelligence at Scale
Procurement is where document automation earns its place in the AI stack. Platforms like V7 Go extract, structure, and analyse contract data across a portfolio's vendor base, identifying pricing anomalies, duplicate suppliers, and renewal risks. The platform flags contract anomalies at scale — tasks that previously required specialist consulting teams billing at day rates.
Coupa and GEP SMART provide the procurement management layer: spend visibility, approval workflows, and supplier consolidation. Together with contract intelligence, they give the operating partner a complete view of procurement spend within weeks rather than quarters.
For detail on how V7 Go handles financial document extraction across portfolios, see the financial statement spreading automation.
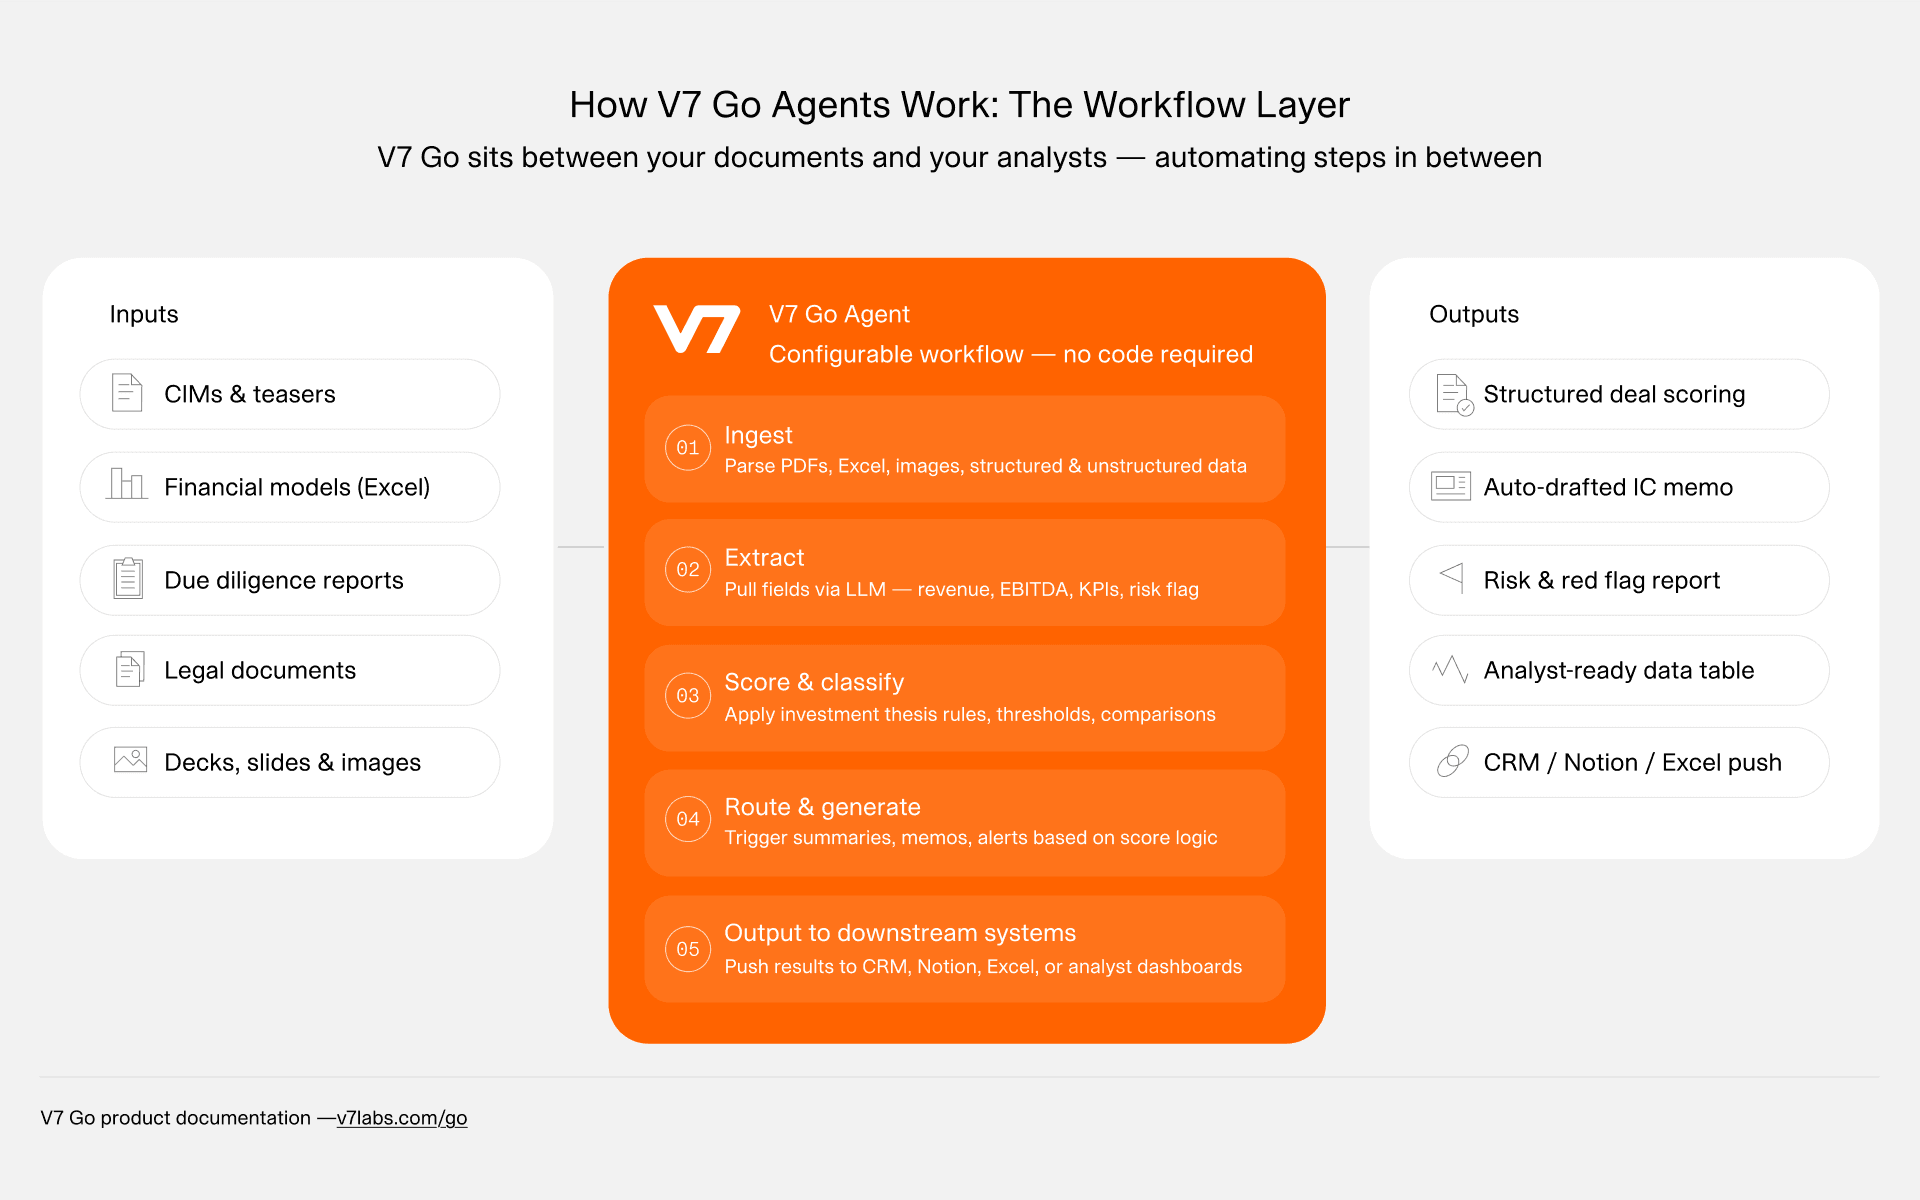
V7 Go's document automation architecture enables portfolio-wide data extraction and normalisation.
The Full AI Tools Stack
Below is the complete operating partner toolkit mapped to function and primary use case.
Tool | Category | Primary Use Case |
|---|---|---|
V7 Go | Document automation | Contract extraction, financial data normalisation, portfolio reporting |
Pricefx | Pricing intelligence | CPQ, price list management, price realisation analysis |
Vendavo | Pricing optimisation | B2B margin optimisation, deal scoring, pricing guidance |
Coupa | Procurement | Spend management, supplier consolidation, procurement workflows |
GEP SMART | Procurement | Spend analytics, sourcing, contract management |
Gong | Revenue operations | Call intelligence, deal tracking, sales coaching |
Intercom | Customer operations | AI-assisted support, customer engagement, ticket deflection |
Clari | RevOps | Revenue forecasting, pipeline risk, CRM hygiene |
Tipalti | F&A automation | Accounts payable, payments, financial close acceleration |
Kinaxis | Supply chain | Demand sensing, inventory planning, supply chain risk |
Mosaic / ChatFin | Financial analytics | FP&A automation, financial modelling, narrative generation |
The Data Layer: Why Document Automation Comes First
Every AI tool in the operating partner's stack depends on clean, structured data. Yet the typical mid-market portco presents exactly the opposite: financial data locked in PDFs, contracts stored as scanned images, and management accounts in inconsistent Excel formats.
Document automation is therefore the first AI deployment in any well-sequenced programme. Before pricing tools can optimise margin, before procurement platforms can identify spend anomalies, before F&A tools can automate invoice matching, the data layer must exist.
V7 Go addresses this directly. The platform processes financial statements, contracts, purchase orders, and operational reports at scale, extracting structured data and normalising it against a consistent portfolio-wide schema. The result is a live data layer that every downstream analytics and automation tool can consume.
The operating partner's role in this phase is to define the extraction schema at portfolio level, not portco level. A schema designed once and applied across 10 businesses means the first analytics query runs on comparable data. That comparability is what makes AI-driven insight actionable rather than anecdotal. For the technical detail on how AI agents handle financial reporting extraction, see the AI financial reporting agent.
The Hold Period Deployment Framework
Sequencing matters as much as tool selection. Operating partners who deploy pricing optimisation before fixing their data layer find the tools underperform. Those who automate F&A before addressing revenue visibility encounter the same problem. The framework below maps AI deployment to hold period phases for a standard 3–5 year hold.
Phase 1: Data Foundation (Months 1–6)
The first six months are the diagnostic and data layer phase. The priority is to establish a clean, structured view of the portco's financials, contracts, and operational data. This phase includes:
Financial statement extraction and normalisation across all reporting entities
Contract inventory: supplier agreements, customer contracts, leases
Pricing data extraction: transaction history, discount patterns, margin by SKU
Spend analytics baseline: vendor count, category spend, renewal exposure
Document automation handles the extraction workload. Human judgment defines the schema and validates the output.
Phase 2: Quick Wins (Months 6–18)
With a clean data layer in place, the operating partner deploys the tools with the fastest EBITDA impact: pricing intelligence and procurement spend optimisation. These two levers alone can deliver 4–8 percentage points of EBITDA improvement within 12 months of structured deployment.
Pricing initiatives in this phase focus on price realisation: recovering margin from informal discounting and pricing inconsistency before moving to dynamic pricing. Procurement initiatives focus on supplier consolidation and contract renegotiation, using the data extracted in Phase 1 as the negotiating baseline.
Phase 3: Growth and Automation (Months 18–36)
The middle period of the hold is where the operating partner deploys revenue-focused AI. Clari for pipeline forecasting, Gong for sales coaching, and Intercom for customer retention form the typical stack. These tools require good CRM data hygiene, an investment worth making in Phase 2 if not already in place.
F&A automation also accelerates in this phase. With pricing and procurement yielding predictable margin improvement, CFOs are receptive to automating the financial close process. Tipalti and comparable AP automation tools reduce manual processing cost and accelerate the month-end close by an average of 30–40%.
Phase 4: Exit Positioning (Months 36+)
In the final phase, AI shifts from operational tool to exit asset. Structured data, documented AI programmes, and measurable EBITDA improvement from AI initiatives are increasingly valued in M&A processes. Acquirers and secondaries pay attention to technology maturity. A portco with a documented, functioning AI stack and a clear data layer is a demonstrably better asset than one without.
The operating partner's role here is to articulate the AI programme in VDD-ready language: what tools are deployed, what EBITDA impact is attributable, and what the handover looks like for the incoming owner. See our comparison of AI-driven versus traditional PE due diligence for context on how acquirers evaluate technology programmes.
Sizing the Opportunity: EBITDA Math for a Mid-Market Portco
Theory becomes actionable when you size the opportunity against a real business. Take a typical mid-market portco: £50m revenue, 12% EBITDA margin (£6m), manufacturing or distribution sector, 3-year hold with an exit EBITDA target of £9m.
A structured AI programme across the four primary levers produces the following improvement trajectory:
Lever | Tool | Improvement | EBITDA Impact (on £50m revenue) |
|---|---|---|---|
Pricing | Pricefx / Vendavo | +3.5% margin recovery | +£1.75m |
Procurement | Coupa / GEP SMART | 3% cost reduction | +£0.9m |
Customer Ops | Intercom / Gong | 1.5% retention improvement | +£0.5m |
F&A Automation | Tipalti | 25% process cost reduction | +£0.3m |
Combined improvement: approximately £3.45m additional EBITDA, taking the business from £6m to £9.45m within a 24–30 month deployment window. That is a 57% EBITDA uplift with no change to revenue strategy.
This is the logic driving the shift from AI as experiment to AI as core value creation lever. The question is not whether the tools work. The question is whether the operating partner has the sequencing right and the data layer in place before deploying them.
Mid-market portcos often lack the in-house technical resource to manage this programme without support. The operating partner model works precisely because it provides both the strategic sequencing and the vendor relationships to move fast without the false starts that in-house AI programmes typically encounter.
Building the AI-Enabled Portfolio
AI is not a single tool. It is a programme: a sequenced set of deployments that compound across the hold period. The operating partners generating the most reliable EBITDA improvement from AI are not deploying the most sophisticated tools. They are deploying the right tools in the right order, starting with the data layer and building out from there.
V7 Go provides the document automation and data extraction foundation that makes every downstream AI tool more effective. From financial statement spreading to contract intelligence to portfolio-wide reporting, it is the layer that turns scattered portco data into a consistent, queryable asset.
If you are mapping AI to your value creation plan, the right starting point is the data audit: what data exists, in what format, and what needs to be extracted and normalised before analytics and automation can generate value. For a view of how PE firms are structuring this programme, see our guide to financial statement spreading automation.

What does a PE operating partner do?
A PE operating partner is a senior executive, typically a former CEO or COO, engaged by a private equity firm to drive operational improvement at portfolio companies during the hold period. They work across strategy, operations, commercial, and — increasingly — technology and AI implementation.
+
How do operating partners create value in private equity?
Operating partners create value through a combination of: (a) operational improvement (procurement, pricing, cost reduction), (b) revenue acceleration (commercial strategy, sales process), (c) management team upgrade, and (d) exit positioning. AI tools are increasingly central to all four levers.
+
What is a value creation plan in private equity?
A value creation plan is the operating partner's structured roadmap for improving portfolio company performance during the hold period. It identifies the 3–5 highest-impact initiatives by EBITDA lever, assigns ownership, and sets measurable milestones against which the PE firm tracks progress.
+
How do PE operating partners use AI?
Operating partners use AI across three layers: (a) the data layer (extracting and normalising portfolio company financials), (b) the analytics layer (pricing optimisation, procurement spend analysis, revenue forecasting), and (c) the ops automation layer (F&A automation, customer service AI, supply chain forecasting).
+
What tools do operating partners use?
AI improves EBITDA via three mechanisms: (a) direct cost reduction (procurement, F&A — typically 2–4% EBITDA impact), (b) margin recovery (pricing — 3–5%), and (c) revenue acceleration (RevOps, customer retention — 1–3%). Combined, structured AI deployment can deliver 5–9% EBITDA improvement within 18–24 months.
+
How does AI improve EBITDA at portfolio companies?
Go is more accurate and robust than calling a model provider directly. By breaking down complex tasks into reasoning steps with Index Knowledge, Go enables LLMs to query your data more accurately than an out of the box API call. Combining this with conditional logic, which can route high sensitivity data to a human review, Go builds robustness into your AI powered workflows.
+
Casimir is a seasoned tech journalist and content creator specializing in AI implementation and new technologies. His expertise lies in LLM orchestration, chatbots, generative AI applications, and computer vision.

