Document processing
11 min read
—


Master the NOI formula that determines property values, loan eligibility, and cash-flow projections in commercial real estate.

Net operating income (NOI) is the single figure that connects a property’s rent roll to its market value, its debt capacity, and its investment return—and the one number where an analyst cannot afford to be imprecise. Get it wrong and every downstream calculation is wrong with it: cap rate, DSCR, loan sizing, investor reporting.
This guide explains:
what NOI is and why it drives every CRE valuation
the formula broken into its components, with inclusion and exclusion rules
a worked step-by-step example using a 50-unit multifamily property
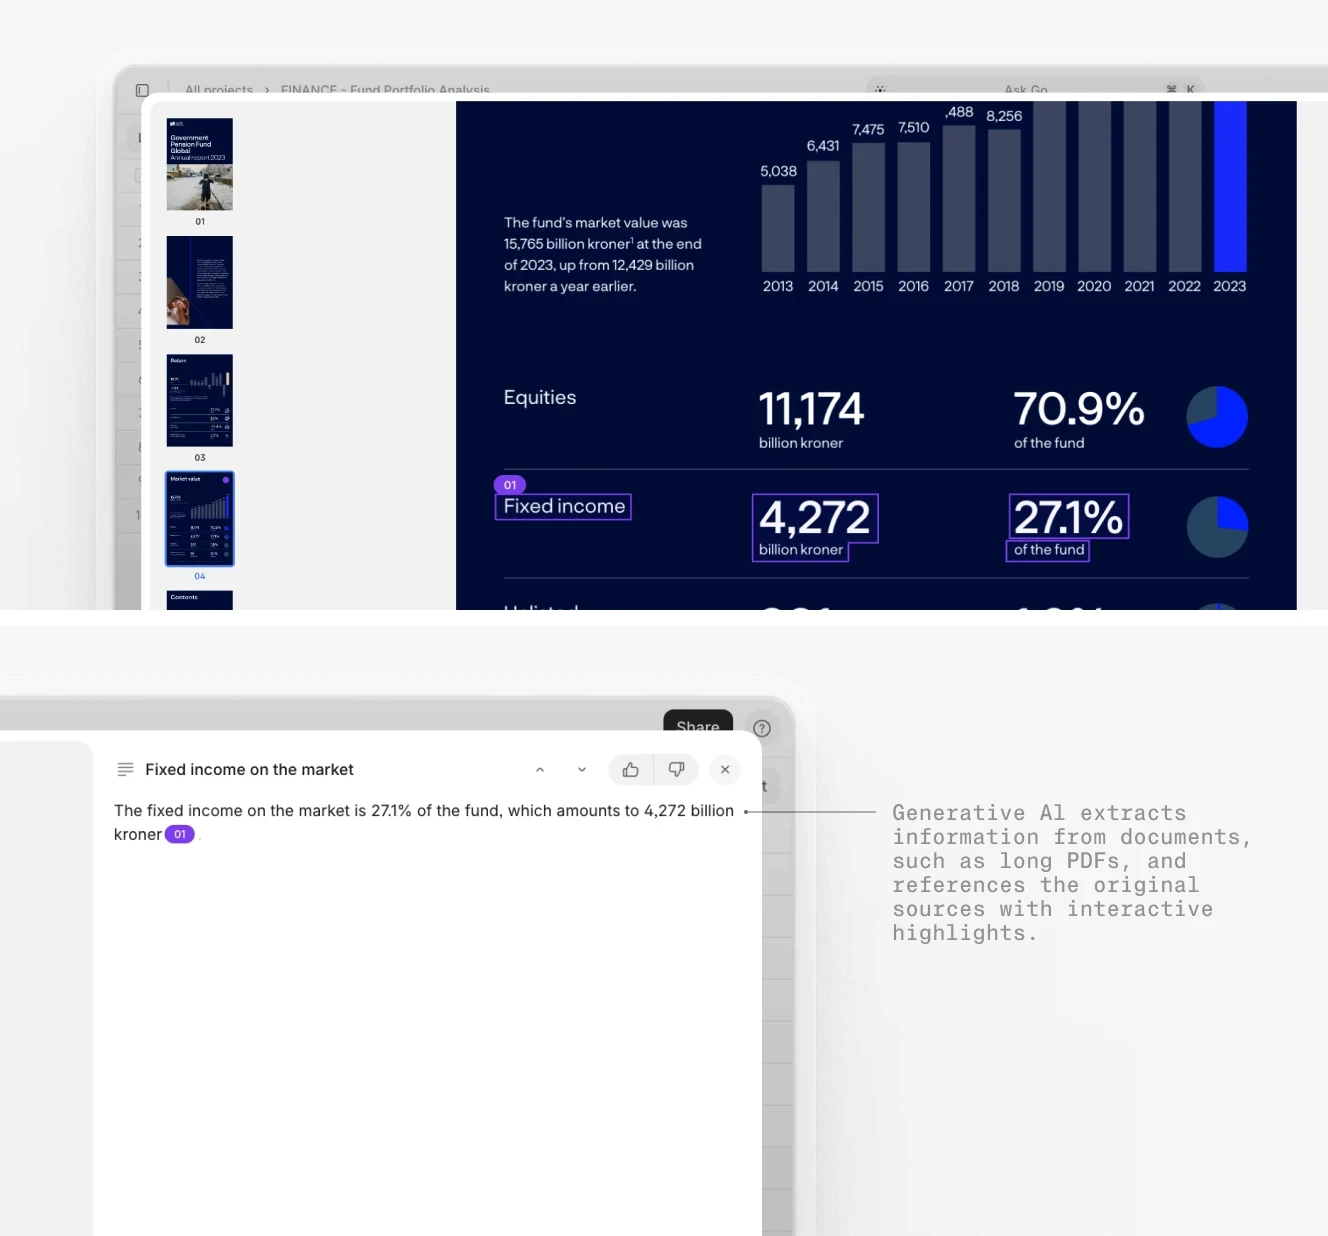
how AI extracts the inputs that feed an NOI model from leases, rent rolls, and operating statements automatically
Whether you are underwriting an acquisition, stress-testing a portfolio, or satisfying a lender’s due diligence checklist, the process is the same: collect the right inputs, apply the formula consistently, and document every assumption.

Document processing
AI for document processing
Get started today
What Is Net Operating Income?
NOI is the income a commercial property generates from its operations after subtracting operating expenses, but before deducting debt service, depreciation, income taxes, or capital expenditures. It represents the cash a property would produce if owned free and clear.
The formal definition used by most commercial real estate lenders, appraisers, and investors is:
NOI = Gross Operating Income (GOI) − Total Operating Expenses
Because NOI strips out financing costs, it lets analysts compare properties with different capital structures on equal terms. A 100-unit apartment complex with a 70% LTV loan and one owned free and clear can be evaluated side-by-side using NOI alone.
Why NOI Matters
Three calculations depend directly on NOI:
Property value: applying a market cap rate to the NOI figure produces an implied sale price
Debt capacity: lenders use NOI to size and approve CRE loans through the debt service coverage ratio
Investment performance: NOI is the baseline for cash-on-cash return, equity multiple, and IRR models
Lenders, appraisers, and equity investors each use NOI as a shared reference point, which is why inconsistencies in how it is calculated create friction at every stage of a transaction.
The NOI Formula
The formula has two inputs: Gross Operating Income and Operating Expenses. Getting each right requires knowing exactly what belongs in each category.
Gross Operating Income (GOI)
GOI is all revenue the property actually collects, or could realistically collect, from operations. It starts with potential rent and then adjusts for vacancy and adds ancillary income sources.
GOI = Potential Rental Income − Vacancy and Credit Loss + Other Income
Component | Description | Example (50-unit) |
|---|---|---|
Potential Rental Income | All units at market rent, 100% occupied | $840,000 |
Less: Vacancy and Credit Loss | Typical 5–10% for stabilized multifamily | ($58,800) |
Plus: Other Income | Parking, laundry, pet fees, utility reimbursements | $18,000 |
Gross Operating Income | $799,200 |
Operating Expenses
Operating expenses are the costs of running the property day to day. The critical distinction is between costs that belong in the NOI calculation and those that do not.
Included in Operating Expenses | Excluded from Operating Expenses |
|---|---|
Property taxes | Mortgage principal and interest |
Insurance | Depreciation |
Utilities (landlord-paid) | Income taxes |
Maintenance and repairs | Capital expenditures (CapEx) |
Property management fees | Tenant improvement allowances |
Administrative costs | Leasing commissions |
Landscaping and janitorial | |
Reserves for replacement |
Debt service is excluded because it depends on how an individual buyer finances the property, not on the property’s underlying performance. Two identical buildings with different loan structures would show different net income figures if debt were included—but identical NOI figures. That comparability is the point of the metric.
The Complete Formula
NOI = (Potential Rental Income − Vacancy and Credit Loss + Other Income) − Operating Expenses
Or equivalently: NOI = GOI − Operating Expenses
How to Calculate NOI: A Step-by-Step Example
The following example works through a 50-unit multifamily property in a suburban market with average monthly rent of $1,400.
Step 1: Calculate Potential Rental Income
50 units × $1,400/month × 12 months = $840,000
Step 2: Apply Vacancy and Credit Loss
The submarket vacancy rate is approximately 7%, consistent with current national multifamily conditions tracked by the National Multifamily Housing Council.
$840,000 × 7% = $58,800
$840,000 − $58,800 = $781,200
Step 3: Add Other Income
Parking ($6,000) + Laundry ($4,800) + Pet fees ($4,200) + Utility reimbursements ($3,000) = $18,000
Step 4: Arrive at Gross Operating Income
$781,200 + $18,000 = $799,200 GOI
Step 5: Subtract Operating Expenses
Expense | Annual Cost |
|---|---|
Property taxes | $65,000 |
Insurance | $18,000 |
Utilities | $14,000 |
Maintenance and repairs | $40,000 |
Property management (approx. 8% of GOI) | $63,900 |
Administrative | $8,000 |
Landscaping and janitorial | $10,000 |
Reserves for replacement | $9,000 |
Miscellaneous | $3,000 |
Total Operating Expenses | $230,900 |
Step 6: Calculate NOI
$799,200 − $230,900 = $568,300
Two quick checks confirm the figure is reasonable:
Cap rate range: At a 6% cap rate, the implied property value is $9.47M. At 7%, it is $8.12M.
Operating Expense Ratio: $230,900 / $799,200 = 28.9%, consistent with the low end of Class A multifamily benchmarks.
Three Types of NOI
When underwriting a property, analysts typically work with three distinct NOI figures. Each serves a specific purpose in the transaction or management workflow.
In-Place NOI
Also called “trailing NOI” or “T-12 NOI,” in-place NOI reflects the property’s actual performance over the past 12 months, drawn from certified rent rolls, bank statements, and operating statements. Lenders use it as the conservative baseline to confirm that the existing property generates enough income to service proposed debt.
Underwritten (Pro Forma) NOI
This is the stabilized NOI the property is expected to achieve once all leases reach market rate, vacancy returns to the submarket average, and planned capital improvements are complete. Underwritten NOI is the basis for acquisition pricing and projected investor returns.
Budget NOI
Budget NOI is the forward-looking income projection for the next fiscal year, used internally for asset management, capital planning, and investor reporting. It drives decisions about rent increases, major repairs, and refinancing timing.
Type | Time Period | Primary Use | Data Source |
|---|---|---|---|
In-Place NOI | Trailing 12 months | Lender underwriting, baseline valuation | T-12 operating statement |
Underwritten NOI | Stabilized projection | Acquisition pricing, investor returns | Pro forma model |
Budget NOI | Next 12 months | Asset management, capital planning | Internal projections |
From NOI to Property Value and Debt Capacity
Cap Rate and Property Value
The capitalization rate converts NOI into an implied property value:
Property Value = NOI / Cap Rate
Using the example property:
At a 6% cap rate: $568,300 / 0.06 = $9.47M
At a 7% cap rate: $568,300 / 0.07 = $8.12M
A one-percentage-point shift in cap rate moves the implied value by more than $1.3M on this property alone—which is why small errors in the NOI figure have large consequences for acquisition pricing.
NOI versus Cash Flow
NOI and cash flow measure different things and are not interchangeable:
Cash Flow After Debt Service = NOI − Annual Debt Service
With annual debt service of $380,000: $568,300 − $380,000 = $188,300
Cash flow measures what a property returns to equity investors after servicing debt. NOI measures property performance independent of financing. Both are necessary; neither replaces the other in a complete underwriting model.
Debt Service Coverage Ratio (DSCR)
Lenders require that NOI cover annual debt service by a minimum margin. The conventional minimum for multifamily loans is 1.25x, as specified in Fannie Mae’s multifamily lending guidelines.
DSCR = NOI / Annual Debt Service
$568,300 / $380,000 = 1.50x, comfortably above the 1.25x threshold.
The OCC Comptroller’s Handbook on Commercial Real Estate Lending describes how bank examiners evaluate CRE loan quality, including the weight given to DSCR in underwriting assessments.
Cash-on-Cash Return
For equity investors, cash-on-cash return divides annual cash flow by total equity invested:
CoC = Annual Cash Flow / Total Equity Invested
Assuming $2.5M equity: $188,300 / $2,500,000 = 7.5%
What Drives NOI
Revenue Levers
Higher NOI comes from two revenue drivers: higher gross rent and lower vacancy. NMHC data shows national multifamily vacancy rates have hovered around 8% in recent quarters, meaning most markets can lift NOI through better tenant retention and faster lease-up.
Key revenue levers include:
Market rent growth through lease renewals and new lease pricing
Occupancy improvement by reducing turnover and cutting average days vacant
Other income expansion through parking, storage, amenity fees, and utility reimbursements
Loss-to-lease capture by bringing below-market leases to current rates as they expire
Expense Management
Vendor negotiation, preventive maintenance programs, and technology-assisted work order management can all cut controllable expenses (maintenance, management, administrative, and landscaping). Non-controllable expenses (property taxes, insurance) require strategic responses: tax appeal filings, competitive insurance bidding, and regular escrow account review.
Operating Expense Ratio (OER)
OER measures operating efficiency as a single percentage:
OER = Total Operating Expenses / Gross Operating Income
$230,900 / $799,200 = 28.9%
Asset Class | Typical OER Range |
|---|---|
Multifamily (Class A) | 30–40% |
Multifamily (Class B/C) | 40–55% |
Office | 35–50% |
Retail | 30–45% |
Industrial | 15–30% |
The example property’s 28.9% OER reflects strong expense control. This figure sits at the low end of Class A multifamily benchmarks, driven by efficient property management and limited non-controllable expenses.


The Document Challenge Behind Every NOI Model
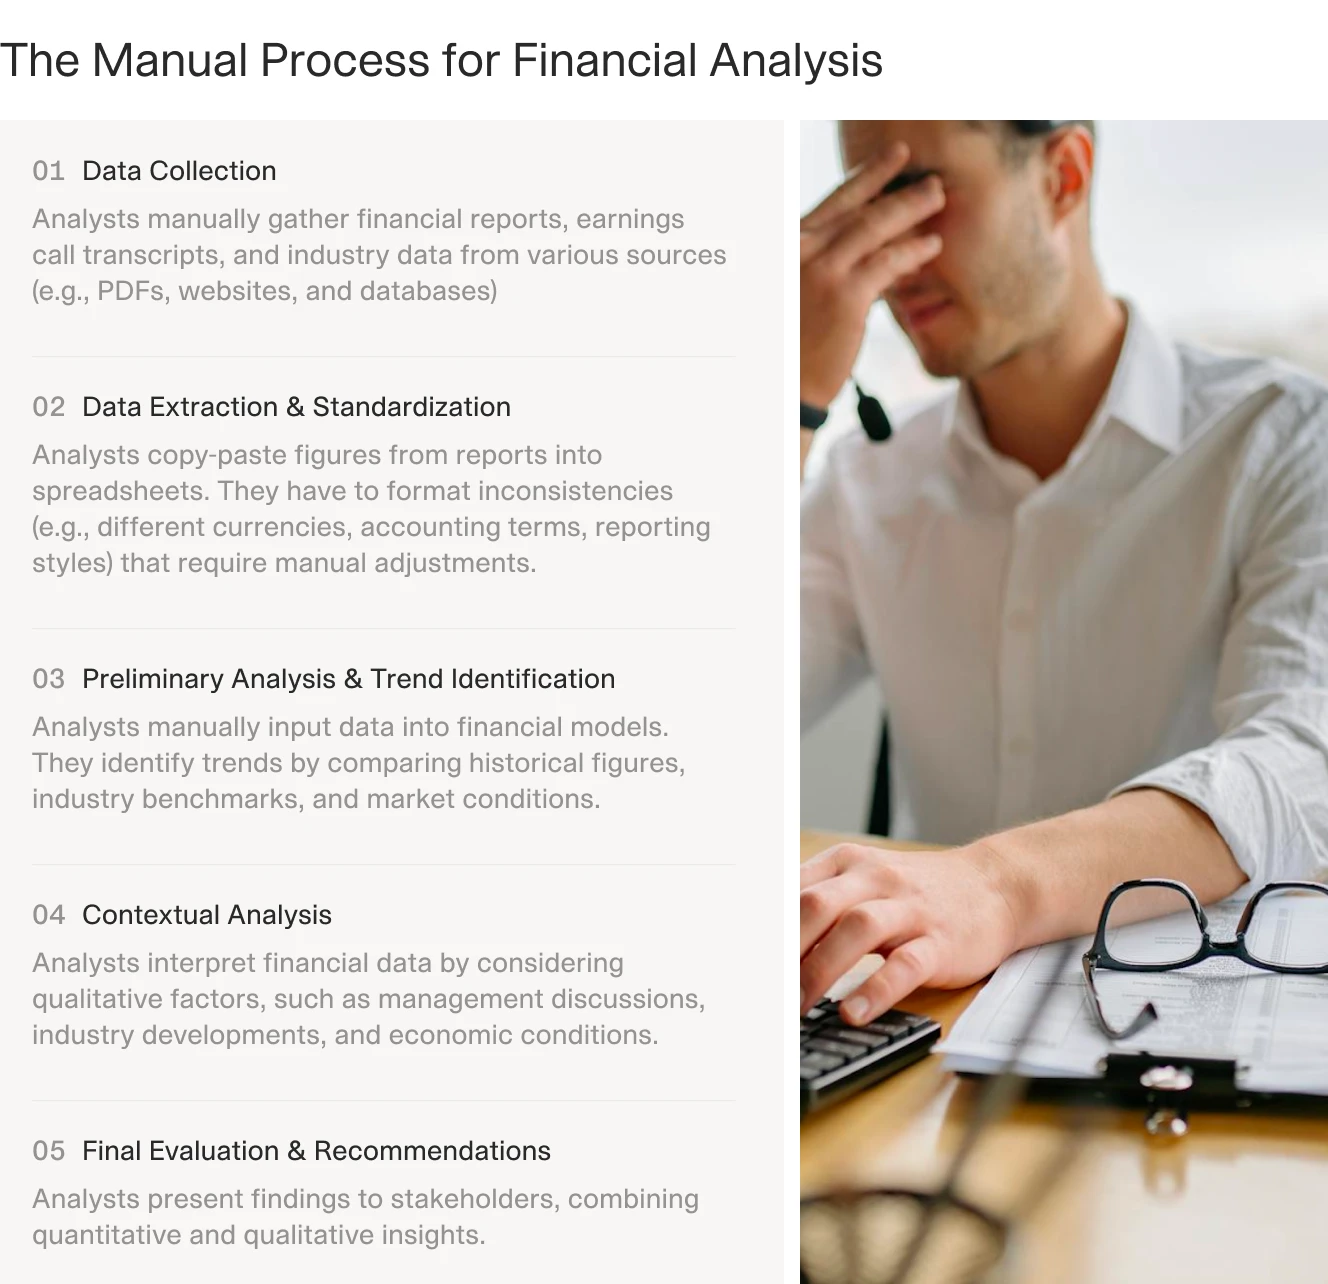
Every number in an NOI model comes from a document. Before any analysis begins, analysts must collect, extract, and reconcile data from multiple source types, each in a different format, produced by different parties, not all of them independently verified.
The five primary document types for NOI underwriting:
Rent roll: unit-by-unit occupancy, in-place rents, lease expiration dates, and concessions. The rent roll is the foundation of any revenue projection and must be current within 30 days of closing.
T-12 operating statement: 12 months of actual income and expense data, used to establish in-place NOI and identify seasonal patterns in revenue and costs.
Lease agreements: commercial leases contain rent escalation schedules, tenant improvement allowances, operating expense reimbursement structures, and renewal option terms that materially affect pro forma revenue projections.
Property condition assessment (PCA): identifies deferred maintenance and near-term capital requirements that affect expense projections and reserve adequacy.
Tax bills and insurance declarations: confirm non-controllable expense baselines and validate the figures reported in the operating statement.
In a large portfolio or complex deal, these documents can number in the hundreds. A 20-property acquisition requires analysts to reconcile 20 rent rolls, 20 operating statements, and dozens of individual lease agreements. All of this happens before a single figure enters the NOI model.
How AI Transforms NOI Underwriting
Traditionally, pulling these inputs together required hours of manual document review: opening PDFs, locating figures, entering them into a spreadsheet, and checking each entry for transcription errors. One transposed digit in a rent roll or operating statement produces an NOI figure that is thousands of dollars off, and a cap rate valuation that diverges accordingly.
AI document intelligence changes the extraction step. V7 Go processes rent rolls, operating statements, and lease agreements automatically, extracting structured data: rent amounts, lease terms, expense line items. The extracted data feeds directly into a financial model without manual retyping.
Relevant agents built on the V7 Go platform:
Lease Abstraction Agent: extracts key commercial terms from lease documents automatically, including rent schedules, TI allowances, and renewal options
Offering Memorandum Analysis Agent: processes OM documents and surfaces financial highlights and underwriting assumptions
Cash Flow Modeling Agent: takes extracted inputs and builds structured cash-flow models ready for analyst review
Property Valuation Agent: applies cap rate analysis to extracted NOI data to produce valuation outputs

Teams that use AI for document extraction redirect analyst hours from data gathering to the judgment calls that require human expertise: choosing the right vacancy assumption, selecting a defensible cap rate, and stress-testing the model against downside scenarios.
For deeper coverage of related CRE document workflows, see the articles on AI lease abstraction, AI in CRE investment, AI commercial loan underwriting, and AI due diligence.
Five Common NOI Calculation Mistakes
Including debt service in operating expenses. Mortgage payments do not belong in the NOI calculation. The purpose of NOI is to evaluate property performance independent of financing, and removing debt service from the equation is what makes cross-property comparison possible.
Using gross rent instead of effective rent. Vacancy losses and concessions must reduce potential income. An NOI model built on 100% occupancy overstates performance and produces an inflated valuation.
Omitting replacement reserves. Capital expenditure reserves for roof replacement, HVAC systems, and major equipment represent a real economic cost. Excluding them produces an NOI figure that overstates actual free cash flow and misleads hold-period return projections.
Misclassifying capital expenditures as operating expenses. CapEx does not belong above the NOI line; it is reflected below NOI in the cash-flow waterfall. Mixing the two categories distorts both the NOI figure and balance-sheet treatment.
Using stale data. In-place NOI drawn from an 18-month-old operating statement may not reflect current market rents, recent tenant changes, or expense increases since the audit period. Always confirm the data vintage and adjust accordingly.
Net operating income is not a complicated formula, but getting it right demands clean inputs from a large set of source documents. The formula is straightforward; the data work that feeds it is not.
That data work is where AI creates the most immediate value for CRE teams. Rather than spending hours extracting rent figures from PDF rent rolls or reconciling expense lines across multiple operating statements, analysts can process document packages automatically and redirect their time toward the judgment calls that matter: validating assumptions, stress-testing the model, and building a defensible investment thesis.
Teams managing active acquisition pipelines or large portfolios can see the full workflow from document ingestion to a completed IC memo at the V7 Go dataroom and IC memo use case page.

Does NOI include debt service?
No. NOI is calculated before debt service. Mortgage principal and interest payments are subtracted from NOI to arrive at cash flow after financing—they do not belong in the operating expense section of the NOI model.
+
Can NOI be calculated on a monthly basis?
Yes. Divide annual potential rent, vacancy, other income, and operating expenses by 12 to get a monthly NOI figure. Monthly NOI is useful for tracking seasonal patterns in revenue and expenses, but the annual figure is the standard basis for cap rate valuation and lender underwriting.
+
What is not included in NOI?
NOI excludes debt service (mortgage principal and interest), depreciation, income taxes, capital expenditures, and tenant improvement allowances. These items are accounted for below the NOI line in a complete cash-flow waterfall, not in the operating expense calculation.
+
What is the difference between NOI and cash flow?
NOI measures property performance before financing costs, making it useful for cross-property comparison and valuation. Cash flow after debt service subtracts annual mortgage payments from NOI to show what the property returns to equity investors. Both metrics are required in a complete underwriting model.
+
What is a good NOI margin for commercial real estate?
Yes. If operating expenses exceed gross operating income, NOI is negative. This can occur in distressed properties with high vacancy, properties undergoing major renovation, or properties facing abnormally high non-controllable expenses such as a significant property tax reassessment. Negative NOI means the property is consuming rather than producing cash from operations.
+
Can NOI be negative?
Go is more accurate and robust than calling a model provider directly. By breaking down complex tasks into reasoning steps with Index Knowledge, Go enables LLMs to query your data more accurately than an out of the box API call. Combining this with conditional logic, which can route high sensitivity data to a human review, Go builds robustness into your AI powered workflows.
+
Casimir is a seasoned tech journalist and content creator specializing in AI implementation and new technologies. His expertise lies in LLM orchestration, chatbots, generative AI applications, and computer vision.

