Playbooks
10 min read
—

Let's go through 5 leading causes of errors, bias, and failure cases stemming from training data, observed across hundreds of V7 projects.

Alberto Rizzoli
Co-founder & CEO

AI is taken for granted while it works and is increasingly able to solve easy tasks found in large numbers within its training set (”in distribution” data). Our job as data scientists is to spot the cases in which it doesn’t work and fix them either through re-labeling data, or tuning hyperparameters. A model may be 99% accurate, however, unless you are aware of what’s causing that 1% of failure cases you are still dealing with unknown-unknowns.

Data labeling
Data labeling platform
Get started today

Since the dawn of transformers (Vaswani et al 2017), hyperparameter tuning and architecture tweaks have diminishing returns and are covered by tools like W&B, Neptune, SigOpt, and others. Changes to the underlying training data instead can still significantly affect model performance and are one of the first areas to pay attention to when debugging a model.
Here are the 5 leading causes of errors, bias, and failure cases stemming from training data that we’ve observed at V7 across hundreds of projects.
1. Over- / Under-representation
Unstructured data on planet earth is skewed by design - we capture images containing myriads of objects, but we’re often interested in using AI to spot rare and unusual ones.
Here’s the class instance distribution histogram for three popular computer vision datasets, notice a trend?

Across the hundreds of thousands of datasets developed on V7, the majority are heavily skewed.
Here’s an example: Given any satellite image of an urban area, for example, there will be a lot of vehicles, many houses, some trees, and few construction sites. If your goal is to detect all the aforementioned classes, balancing the weight of each class at training (ergo influencing how much the model pays attention to underrepresented classes) won’t always work in your favor.
The lower variance (read: difference in appearance) in your under-represented classes means the model will struggle to detect rare varieties of this rare class. For example, a labeled construction site that doesn’t use traffic cones, or looks unusual because it is currently unmanned.
As AI moves further towards self-supervised learning, this issue is magnified. For example, using a generative model like Stable Diffusion to create 100 images of “A swan on a lake” will produce exactly zero black swans, and zero nocturnal or sunset backgrounds, even though these can be easily found (in small numbers) in its primary training set Laion5b.

So what’s the solution?
For the time being, our best bet is to understand that under-represented classes will be biased against, even with our own best efforts towards balancing their weight on a network. The only true solution is to find more imagery, with representative variations, and add them to the training set.

How to spot over/under-representation
Make sure you’re using a dataset management tool that is able to count instances of classes within each image or video. Most tools will give an idea of class distribution, however, if you’re working on object detection or segmentation challenges, instance distribution becomes more important.

An example of an instance distribution histogram on V7 across different label types
Experiment: Testing the effects of under-representation.
Variance within a class can also skew your results.
Let’s run a quick experiment. We’ve collected 2,000 images of five bird species, with each species being represented in 200 images, except for finches which has 1,000 images. Each instance of a species was labeled with a polygon to then train a Mask-RCNN model to detect them.
Among these species are cardinals, whose females are less often photographed as they don’t have the same crimson feathers as males. Across the 200 images with cardinals, only 12% of them are female.

The over-represented class is the 1,000 finches. These very diverse birds have many appearances ranging from colorful bright patches to forest browns. They almost represent a “miscellaneous”, “other” or “everything-else” class, but are in reality one species.

What happens if we train a model on this dataset?
The low representation of the brown variant of cardinals, relative to the higher representation of variegated finches, has led all female cardinals in the validation set to be misidentified as finches by the model.

In conclusion:
Measure your instance representation - use a dataset management tool
Be aware of variance within your class appearance - label variants with attributes or properties and test models within that subset for a true understanding of its weaknesses
Be careful with generic classes - these may absorb weights belonging to you rarer, underrepresented, and more valuable variants.
2. Label Tightness
Loose boxes or tight boxes? How many pixels or margins can we tolerate? How important is it for segmentation to be pixel-perfect?
These are all common questions we encounter in our research at V7. Below is some evidence to the case.
Most open-source datasets vary significantly in the quality of their labels. For example, COCO’s labels are jagged and coarse, whilst OpenImages (which are party AI generated) are closer to being pixel-perfect.

Experiment: Measuring the effects of loose labels
To keep our results unbiased, we’ve created our own variant of a dataset in tight and loose variants, to explore the effect this has on models. To keep things uniform across this set of experiments, we have picked Mask-RCNN as an instance segmentation architecture for the model, however, we will use it for object detection purposes
Using model-assisted labeling, we annotated 1,000 vehicles in the same east-London borough (red roofs, uniform suburban roads, low variation) and manually inspected each label to ensure it is pixel perfect.
Often the confidence output of models trained through V7 act as a good indicator for instances that may not be perfectly annotated.

Step two: For each mask, we extract its containing bounding box so we have perfectly tight boxes around 1,000 vehicles.
Step three: We generate a copy of this dataset and apply a 5% random variance to the labels. That means a box’s width and height may vary up to 5% of the total width/height.
Step four: train a model using the two datasets, here’s the result below

The loose box dataset leads to a difference in recall that would surely justify the added cost of improving label quality. The overall outcome of many of these labeling issues is the following:
The % of error in training data often magnifies the total number of errors the model makes on a test set.
That means if 2% of a class is mislabeled in a training set, the resulting model error is likely to be >2%.
We can visualize some of the results below, and some of the common causes.

The looser label area includes more background pixels. Models are therefore rewarded by adding a little bit of a margin to their output, which can lead to labels crossing over onto other instances and very poor results on occlusion.
Spotting loose labels and fixing them
To detect poorly labeled instances that may confuse your model, you may run a consensus workflow where the intersection-over-union of a model’s output versus ground truth surfaces any disagreements.

We also recommend always adding a QA stage to labeling workflows. The best way to spot loose labels and provide feedback to labelers is with the human eye.
3. Color Bias
Be careful with categories of objects that often exhibit a bright, uniform color, as models tend to emphasize the importance of unusually colored or textured objects regardless of the context they find themselves in.
For example in the misclassifications below, colorful textures or shapes may recall objects that commonly exhibit that color, rather than the more salient and unusual subject in the middle of the frame.

Uniform or repeated patterns often lead to false positives as models seldom pay attention to context, for example, a red exercise ball to a model on white flooring may fool the model into thinking it's a tomato on a ceramic plate.
Color may also affect your model if it's found in the background, for example, a frog on the green grass is more likely to be classified as a squirrel.
Avoiding color bias in training data
To measure and avoid color bias, try training your model on a greyscale version of your dataset. If you want to go the extra mile, you can compare the color vs greyscale versions of the model, and surface any image in which there is disagreement.
Regardless of how much data ends up containing color bias, this is a useful exercise to be aware of the total variance of your dataset, and the types of objects that may lead your RGB model to be biased.

There aren’t many things you can do otherwise, aside from understanding that some of your classes may unusually colored variants (such as a white NYC taxi).
Something that may help is producing class mosaics that help spot unusually colored variants.

4. Labeling Workflow
One of the most common causes of labeling errors comes from human labeling fatigue. This has measurable results on AI accuracy and ultimately business impact. As stated earlier, errors in training data multiply their effect on model performance, therefore even a 2% reduction on labeling errors can lead to a 3, 4, or 5% reduction in that model’s error rate.
A labeling workflow is the series of steps and instructions that each image or video goes through in the labeling process. The assembly line for training data, if you will.
Measuring the effects of good labeling workflows
Let’s run an experiment with 2 teams of 3 labelers. We’ll call them team 1 and team 2. We will label 200 satellite images.
Team 1 is instructed to label all solar panels, vehicles, and crossings using polygons.
Team 2 instead has Labeler 1 focusing on solar panels, Labeler 2 on vehicles, and Labeler 3 on crossings.

Each team is given the same amount of time to label all 100 images, and the same tools, only Team 2’s workflow encourages each labeler to focus on 1 category.
The resulting datasets have a significant difference in recall, with Team 2 spotting 3.4% more objects than the rest.

When using Team 1’s dataset to train a model, we achieve an MaP of 60.67%, whilst Team 2 brings us a higher accuracy at 76.25%. As stated earlier, these training data errors multiply biases in the actual model. This is especially true as the majority of omitted objects are among the rarer ones (eg solar panels) and will skew weighted accuracy scores. Moreover, they will suffer from the under-representation bias stated earlier.

5. Recall: Missing out on objects that are there
The most impactful issue you can fix in your training data is fixing recall errors. Recall errors are when labelers (or models in model-assisted labeling) omit an object entirely. The model is therefore heavily punished for trying to predict this object during training.
Recall errors in training data often occur in images that probably shouldn’t have been labeled in the first place. Pieces of data that your model already is quite sure of, and where we suddenly decide to omit an object (by mistake).
You can avoid these expensive errors by trying a subtractive labeling approach. You may run part of your dataset through a model and only label data where the model’s confidence doesn’t do particularly well. On V7, you may achieve this using Logic stages in your workflow after running images into a Model stage with a low confidence threshold.
Once separated the images tend to be over-labeled given the confidence threshold of the model being set to low, and the labeler’s job is therefore to remove unnecessary labels and refine the output.


Measuring the effect of Recall Errors
Let’s run an experiment. We will train a person segmentation model on 200 images. To speed things up, we are using an automated labeling tool with human guidance.
We then copy the dataset and randomly subtract 12% of all instances.
Then, as usual, we train to Mask-RCNN models. The results are very significant. The model with only 88% of ground truth instances labeled ends up missing almost half of all instances after being trained.
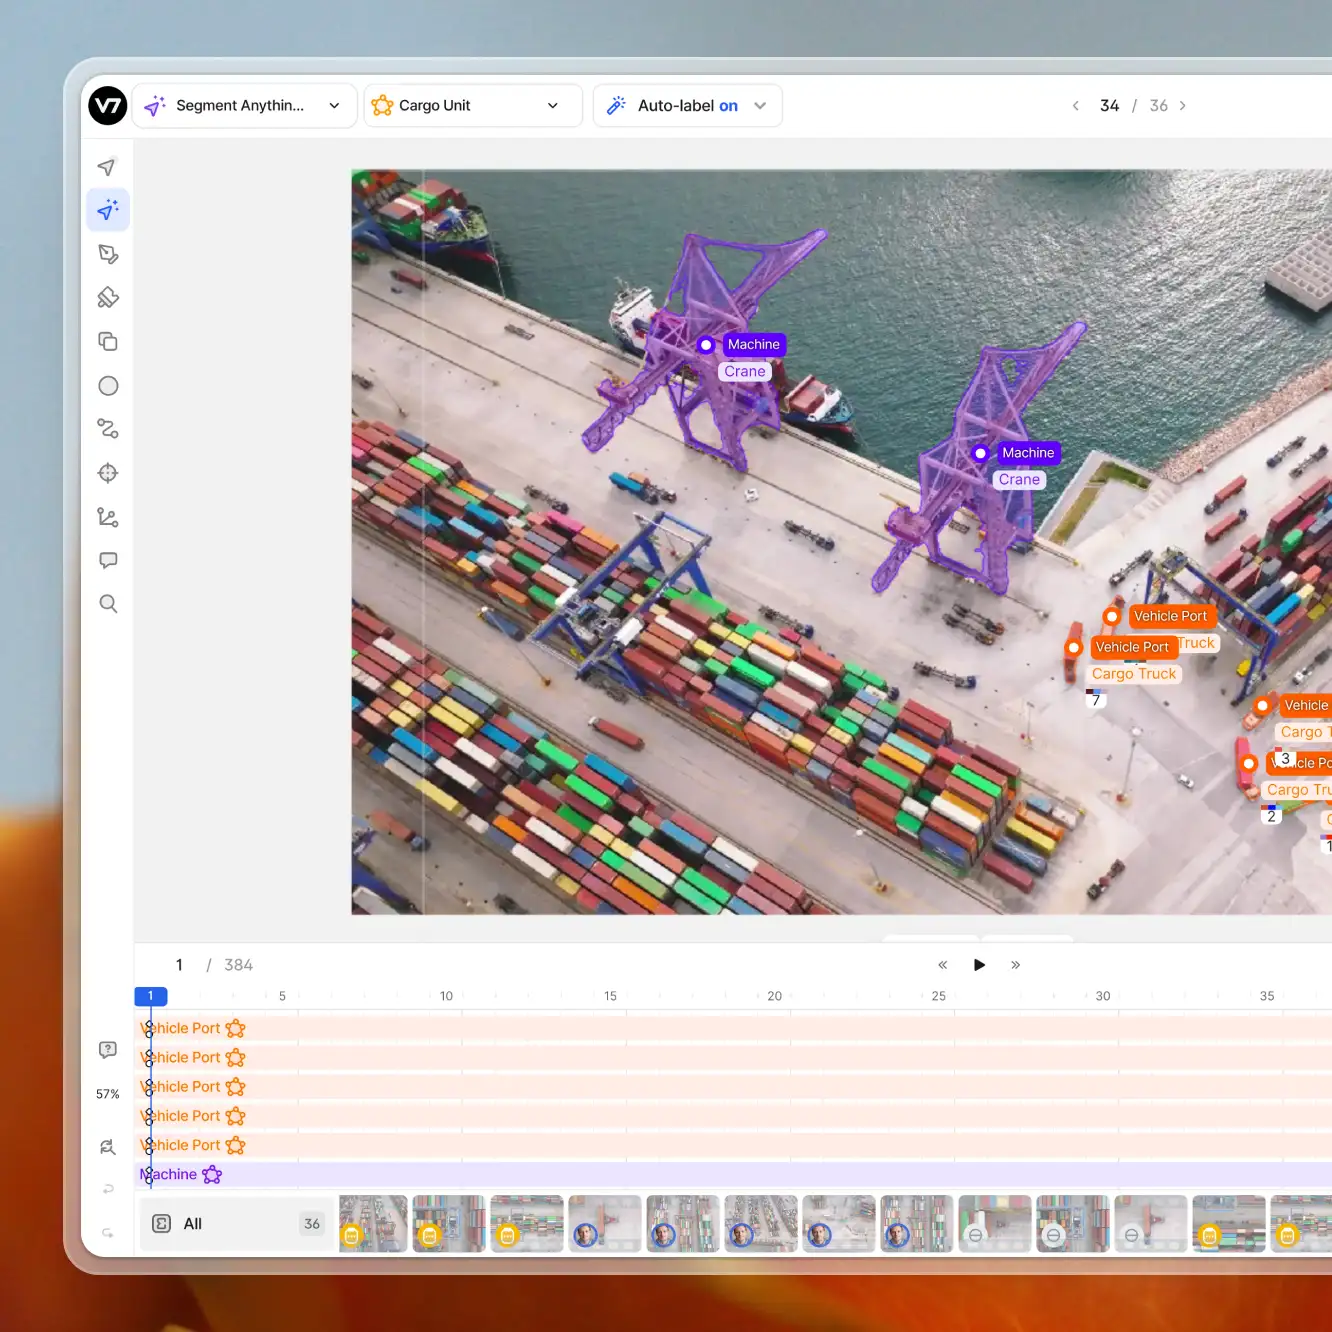
You may see the qualitative results of the two models in the GIF below. Note how the timeline towards the bottom where all annotations are listed is far more scarce towards the beginning where the model trained on only 88% of instances is displayed.

In summary, the 5 most common training data errors all have viable solutions. Some involve tooling, some structure, and all of them have a multiplicative effect on your model’s failure cases.