GraphRAG vs RAG: A 1,000-Document Benchmark on Private Markets Data
Graph retrieval holds 94-97% accuracy from 10 documents to 1,000. Vector search falls to 72%, and to 36% on the questions that decide a deal.
A vector search stack answers 72.1% of a fixed question set on 1,000 documents. A Context Graph answers 93.8%, and 91.7% on the hardest tier against 36.3% for vector search.

V7 Team
V7 Go
A smarter way to manage due diligence and underwriting
01 / The result
What the GraphRAG vs RAG benchmark found
Give a production vector search stack a thousand private markets documents and it answers 72.1% of a fixed question set correctly. Give the same questions, the same model and the same prompt to a Context Graph and it answers 93.8%. Switch both on together and it answers 97.1%.
On the questions that require reasoning across several documents, which is most of the work a deal team actually does, the split is starker: 91.7% against 36.3%. Vector search gets roughly one in three.
That is the short version of the GraphRAG vs RAG question. And the number that matters is not any of the ones above. It is this: the graph scores the same at 1,000 documents as it does at 10. Vector search does not. It starts at 83.7% on ten documents and slides from there, while its cost per question climbs from 28 cents to 34 and its slowest answers stretch past three minutes.
Vector search matches text against text. Ask which of a fund's holdings carries the highest unrealised value and no document contains that sentence. One document lists the holdings. Another carries the valuations. The ranking exists nowhere until somebody builds it, and matching text cannot build things. A context graph builds it at ingestion and keeps it.
Three configurations answered the same 40 questions: a Context Graph alone, a Context Graph with vector search available beside it, and vector search alone. Everything else was held constant. The only thing that changed between arms was which retrieval surface the system could reach.

The four measures at 1,000 documents.
Run the same card at 10 documents, then 100, then 1,000, and the shape of the result appears. Both graph arms hold. Vector search declines on every axis at once: accuracy down 11.6 points, cost up, latency up, tool calls up.
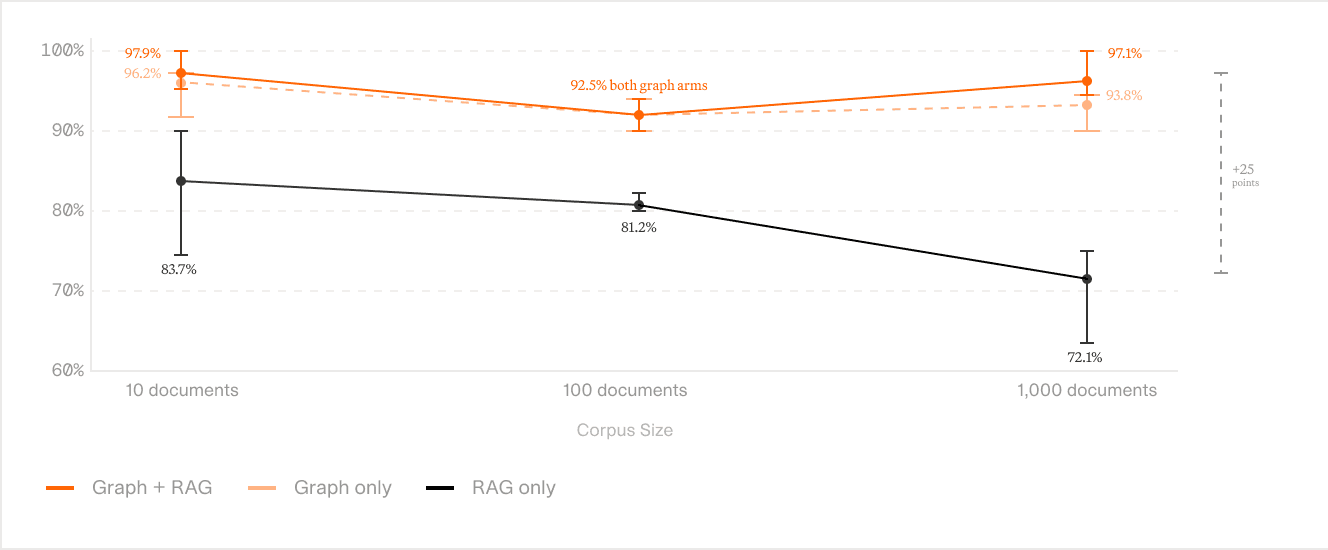
Bars show the full spread from best to worst run at each configuration.
Averages can hide a system that is usually right and occasionally catastrophic, so the spread is worth reading. At 1,000 documents the worst individual graph run scored 90.0%. The best individual vector search run scored 75.0%. The two distributions do not overlap anywhere, across every repeat and both document sets.
One more result, because it changes what the decision is. The two graph arms cost the same, run at the same speed and use the same number of tool calls. Leaving an existing vector deployment switched on beside a graph is free. This is not a migration.
02 / The distribution
The gap is not spread evenly
Reporting only the 25-point headline would misrepresent both systems. Vector search is not broadly worse. It is specifically worse, on one class of question, and that class happens to be the one firms buy these tools to answer.
The card grades into four tiers. On simple lookups, where the answer sits inside a single passage, every configuration does well and the differences are not worth discussing. On the hardest tier, where the system has to find a set, filter it against a condition and then reduce over the result, both graph arms stay above nine in ten and vector search gets 36.3%.
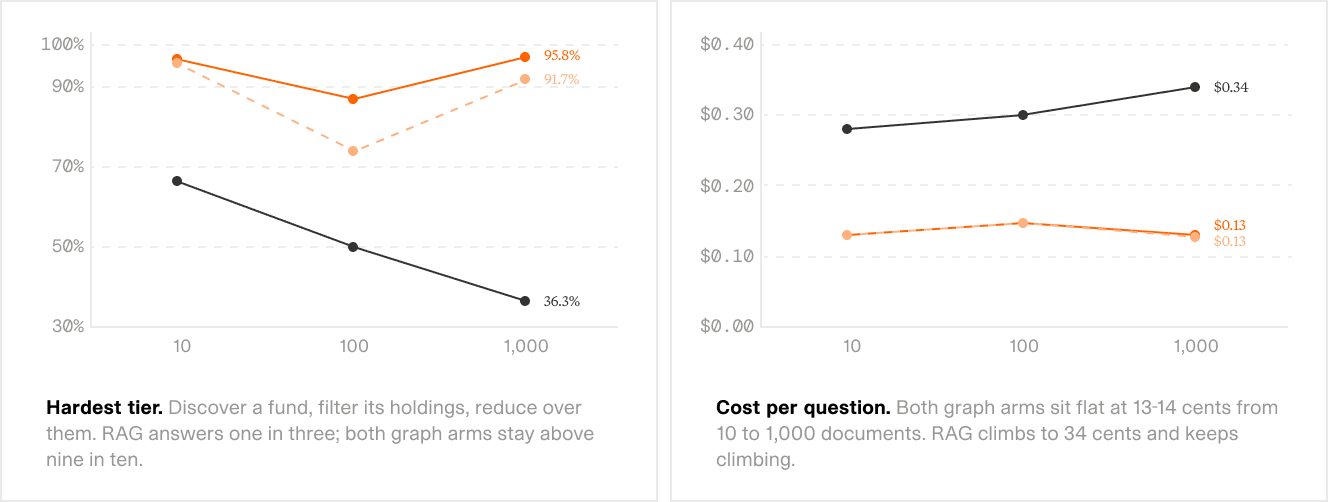
The hardest tier and cost per question, across all three corpus sizes.
Those are questions like: which holding in this fund carries the highest unrealised value, how many companies does this fund hold exclusively, what sector does the top performer sit in.
One question, run both ways
Question 29 asks which portfolio company, among those held exclusively by the fund with the highest deployed capital ratio, had the highest cost basis. The answer is Amber Matrix Systems.
Vector search worked on it for 207 seconds and returned this:
Thomas Farm Systems had the highest cost basis among Smith Buyout Fund V's exclusively held portfolio companies: €163.9 million. Smith Buyout Fund V had the highest Q4 2025 deployed-capital ratio at 82%.
Read it as a partner would. It names a company, gives a figure to one decimal place, names the fund and shows its working. It is also wrong at the first step: that is the wrong fund, pulled from the padding documents rather than the ten that hold the answer. Everything after it inherits the error, and the 82% is a real number attached to the wrong entity.
The same question with the graph available: correct, in 27 seconds.
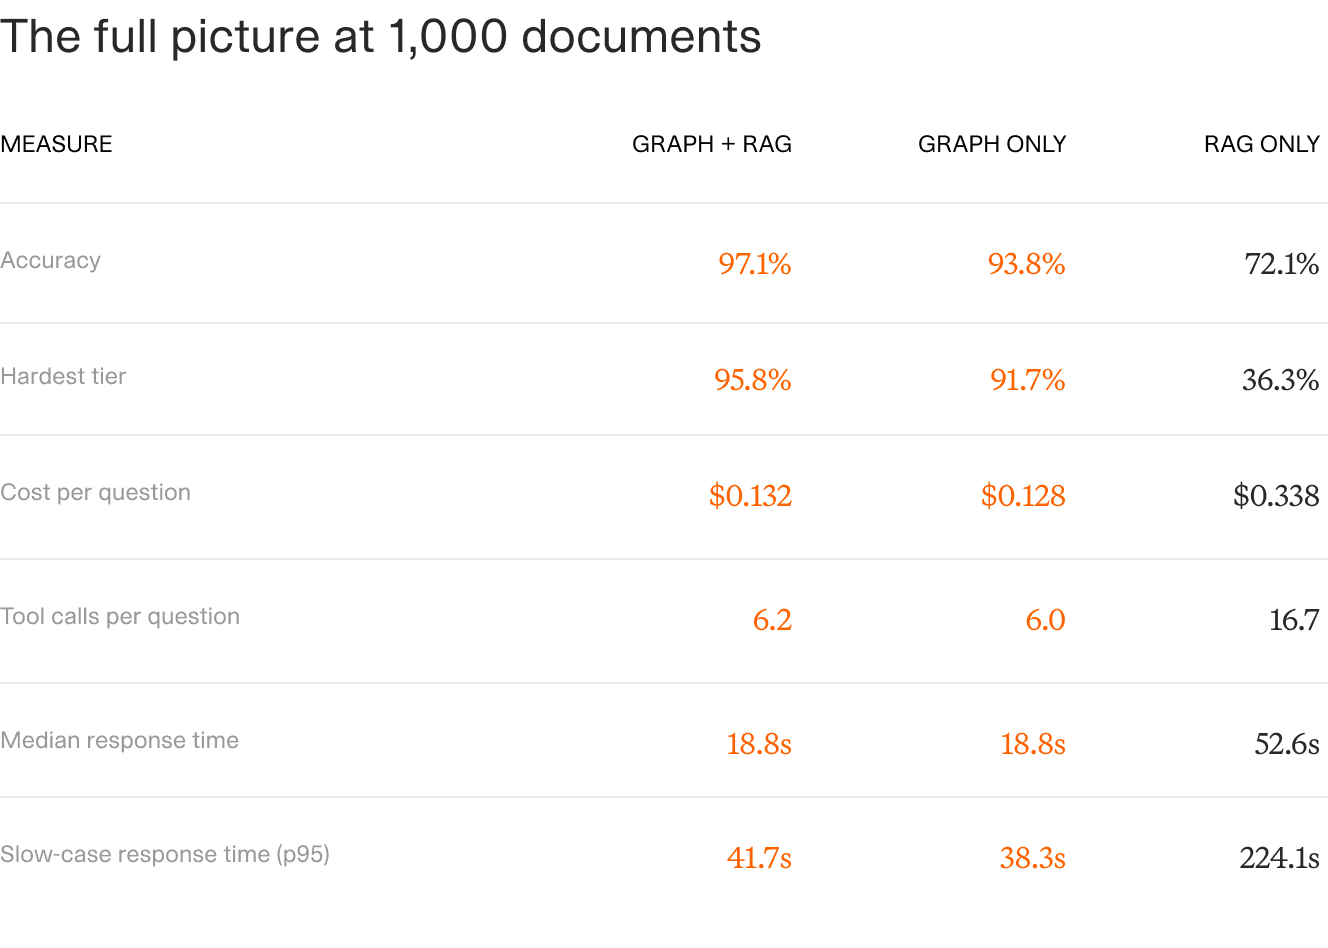
All three configurations at 1,000 documents, pooled across both document sets and every repeat.
The bottom three rows scale differently from the top two, which is the part budget holders should read twice. Graph cost sits flat at 13 to 14 cents from 10 documents to 1,000. Vector search climbs to 34 cents and is still climbing at the top of the range tested. Its slowest 5% of answers take 224 seconds.
A four-minute answer is not a slow answer. It is an abandoned one.
03 / The failures
Three things vector search cannot do
Every question vector search lost has the same shape: the answer is not written anywhere. Embeddings are very good at finding a passage that is about a topic. They have no mechanism for building an answer that no passage contains. Three failures account for the gap, and none of them is a tuning problem.
It cannot tell near-identical names apart
One test corpus contains nine separate entities whose names begin "Amber Anchor". To a similarity search those nine sit almost on top of each other, and the retrieval arm repeatedly reported that it could not determine which one was meant. Keyword search does not rescue this: grep matches a string but cannot see that "oil and gas" and "fossil fuel" describe the same sector.
Both dense and sparse retrieval resolve entities at query time, from text, under a deadline. A graph resolves them once, at ingestion, with the whole document in view. By the time the question arrives the ambiguity is already gone. We argued this before, for knowledge graphs against vector databases. Here it has a price attached.
It cannot rank a set it never assembled
Much of the hardest tier asks which item in a group ranks highest. We measured how close the top two candidates were on each. Where the winner beats the runner-up by less than 3%, vector search gets about a quarter of them right, which is roughly what guessing produces. The graph got every one, on every repeat, across both document sets.
Ranking a set of edges is a query. Reading two similar numbers out of two different passages and deciding which is larger is a comprehension task. One degrades under ambiguity. The other does not.
It cannot count
Ask how many portfolio companies a fund holds and the system has to find every mention and miss none. Vector search has no way of knowing when it has finished. Across the list-answer questions it scored precision 1.00 and recall 0.50: every company it named was really held by that fund, and it found half of them.
That combination is more dangerous than being obviously wrong. Asked how many of one fund's companies are also held by another fund, it answered six and listed all six correctly by name, with the co-holding fund beside each. The answer was seven. On a harder variant it produced a table of nine companies under a stated total of ten, having followed the fund-of-funds chain backwards. The answer was four.
The table is the problem. A bare wrong number invites a check. A formatted table of real company names reads as the check having already happened.
04 / The architecture
What the Context Graph does differently
The work happens before the question is asked. Subjects, relationships and metrics are extracted from the documents at ingestion, out of tables and narrative alike, and attached to their source with citations down to the line. At query time it walks that structure. Nothing is being read or reassembled while the analyst waits.
So cost and latency do not move as the corpus grows. Going from 10 documents to 1,000 left the answers sitting in the same ten source documents. Nothing was added but noise. Vector search now has to find those ten among a thousand, and recall degrades as an index grows. Lost in the Middle documents the same pattern under different conditions. Anthropic's contextual retrieval attacks the same weakness from the chunking side and reduces it without removing it.
The graph's workload across that hundredfold increase changed by nothing. Same six tool calls. Same 13 cents. Same latency.
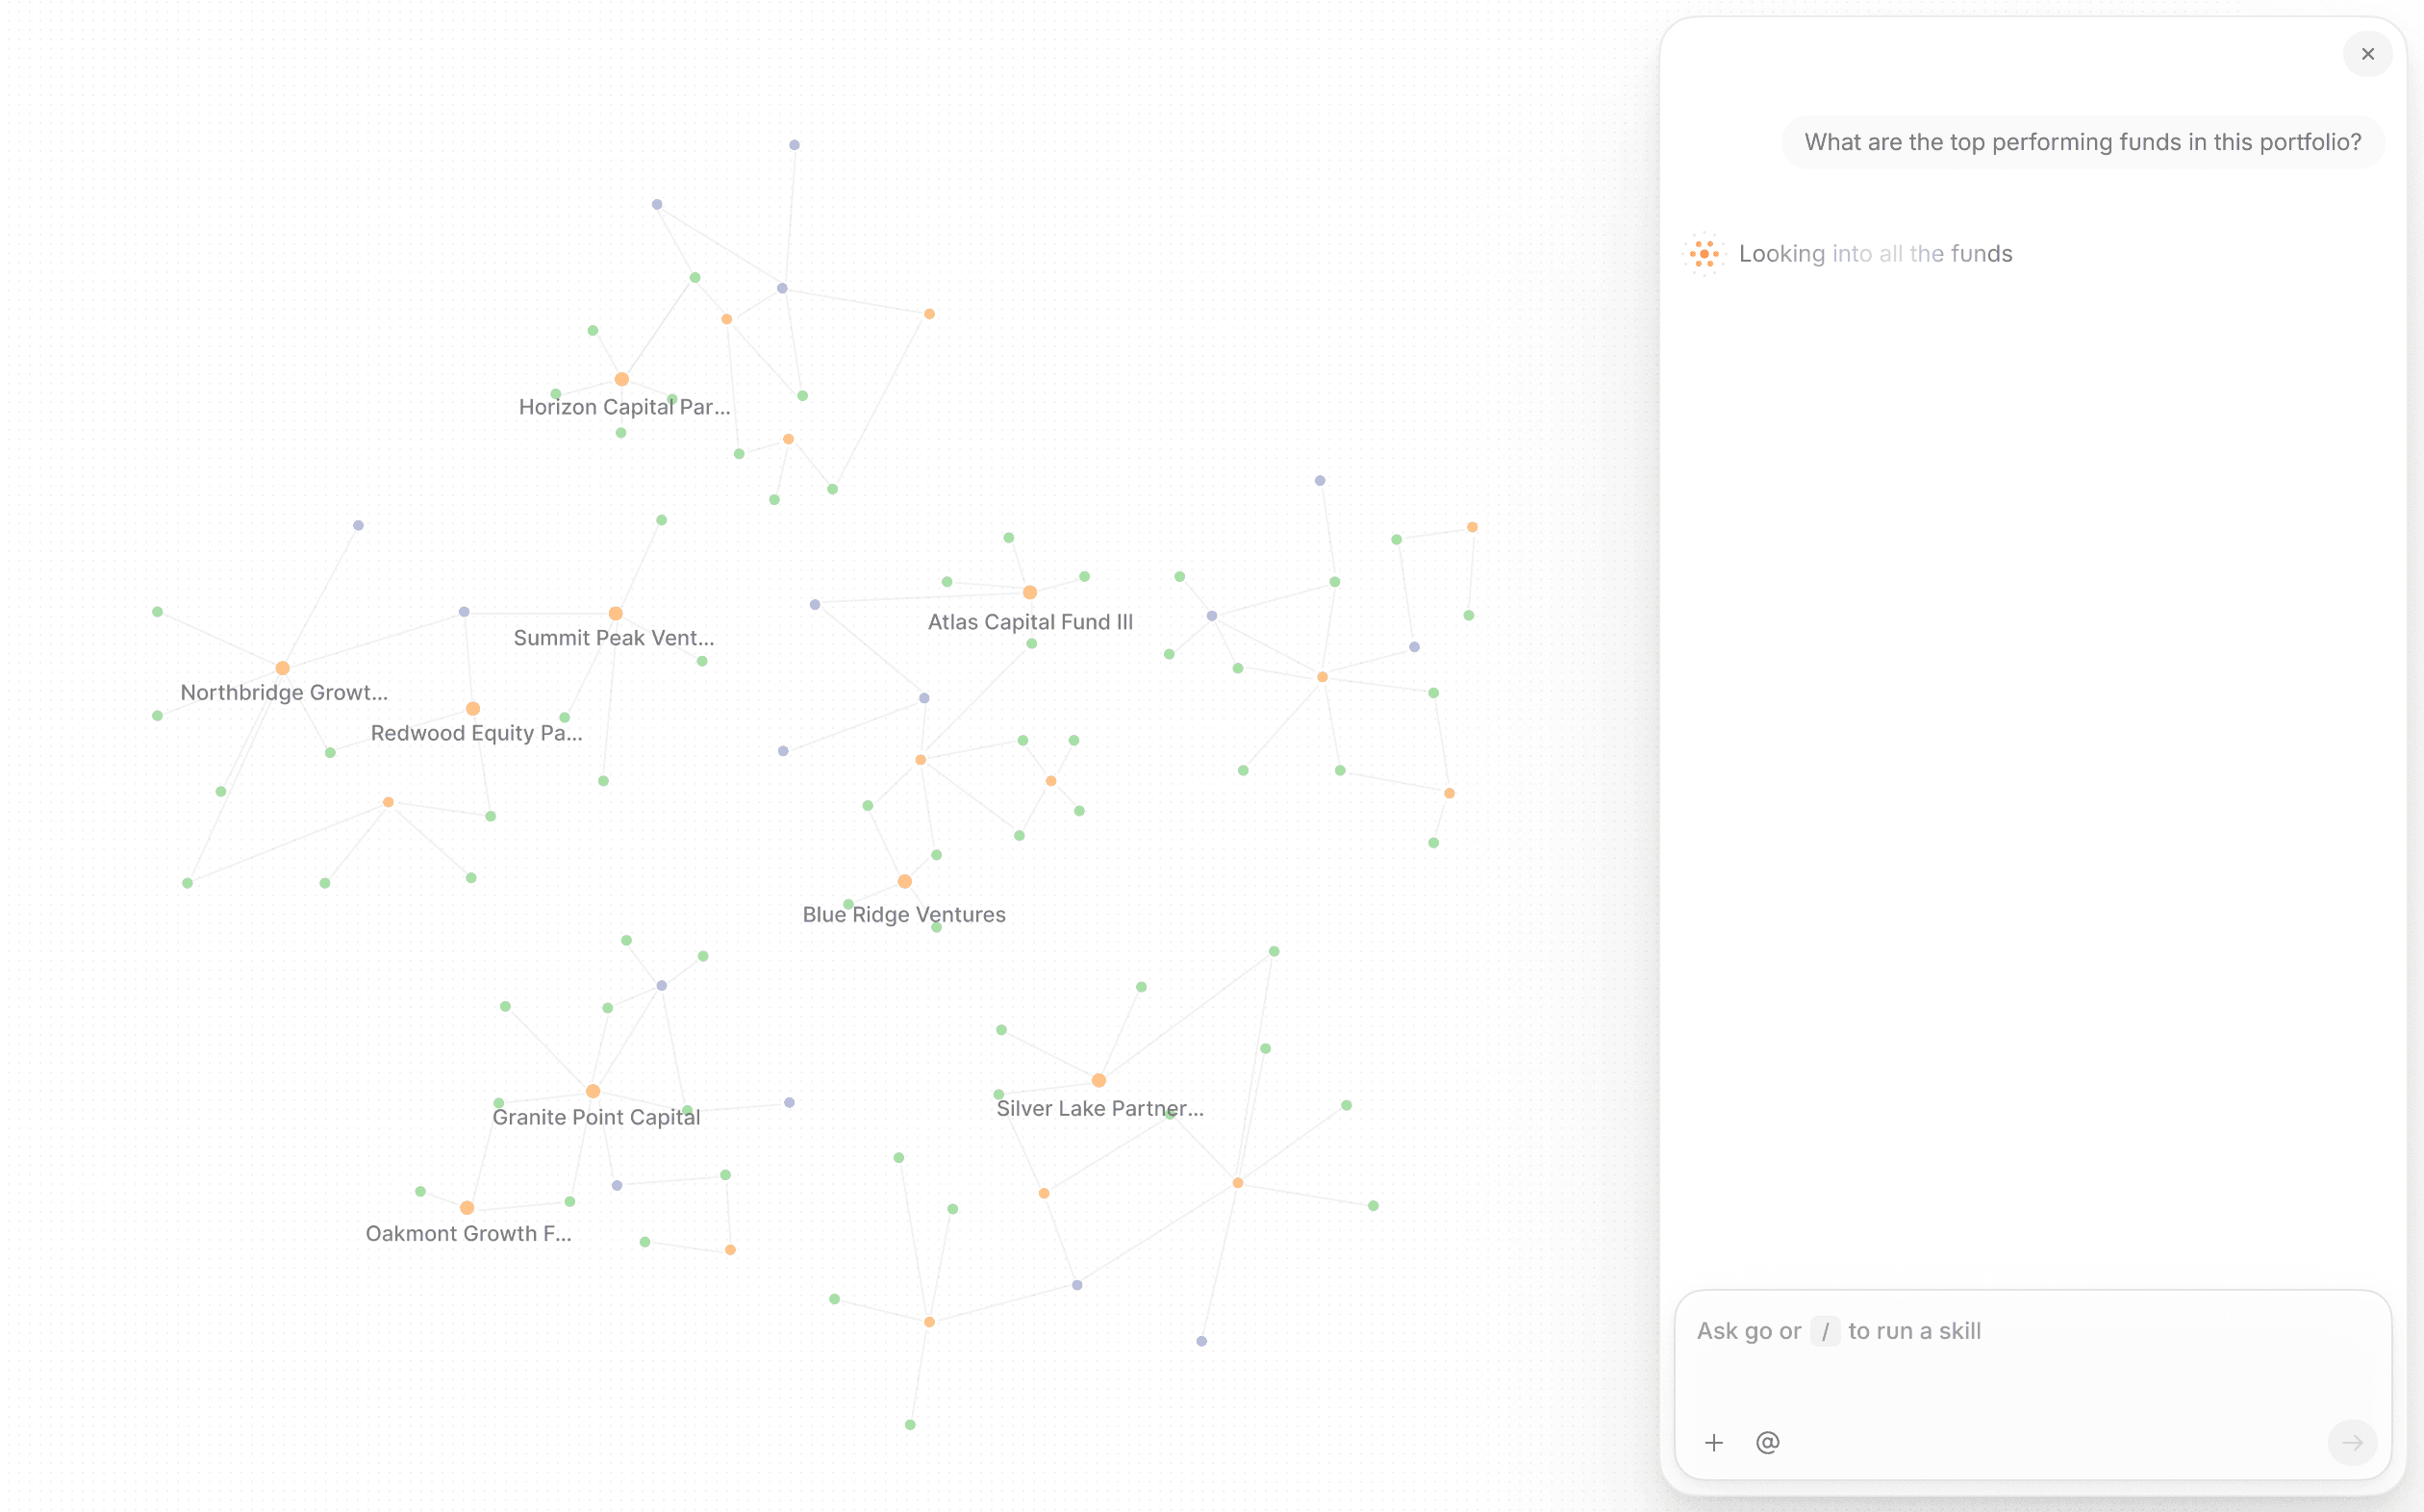
Entities, relationships and metrics resolved at ingestion, with every value still attached to the document it came from.
It also matters that there is an ontology. Extraction targets entity types, relationships and metrics chosen because they are what people ask about. That is the difference between a graph and the automatic entity-soup approach that left early GraphRAG projects with a web of near-duplicate nodes needing vector search to untangle. Independent work points the same way. A 2025 systematic evaluation of RAG against GraphRAG finds the two win on different question types. Microsoft Research's GraphRAG work reports the same split: passage questions on one side, corpus-spanning questions on the other.
05 / Portfolio scale
What this changes at portfolio scale
Evaluate vector search on a handful of funds and the numbers look acceptable. That is the trap this whole result describes. A real portfolio is a hundred times bigger than a pilot, and at that size vector search answers barely a third of the multi-step questions.
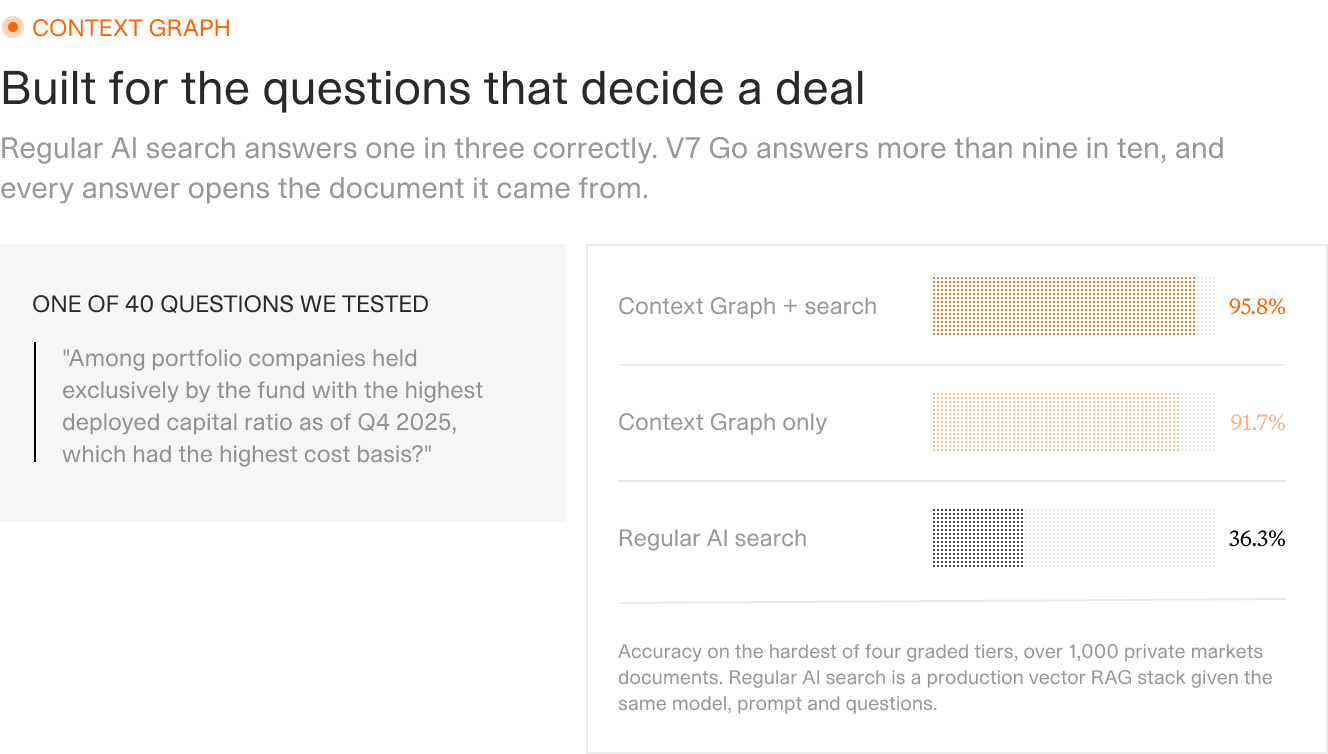
One question from the hardest tier, and how the three configurations answered it.
It lands in three places. In diligence, the questions that decide an investment committee outcome are almost all multi-step: reconcile this KPI across four reporting periods, list every contract with a change-of-control clause, tell me which of these holdings we have seen before. That is where a data room to IC memo workflow either holds up or quietly starts producing plausible numbers.
In monitoring the pressure is worse, because the corpus only grows. Every quarter adds another set of reporting packs to the same index, so a system that degrades with corpus size degrades on a schedule. In LP quarterly reporting that shows up as an analyst rebuilding by hand what the system was supposed to deliver.
And in cost, which is the easiest to model and the least discussed. At 34 cents a question and rising against 13 cents and flat, a monitoring workflow running thousands of questions a quarter has a budget line that tracks the document estate on one architecture and does not on the other.
This is what V7's Context Graph is for. It runs as the knowledge layer under the firm's workflows. A screening question arrives against what the firm already knows about the sector, the sponsor and the last time this deal came round, not against a blank prompt and a thousand PDFs. We cover the same layer in more depth for private equity and venture capital teams. None of which removes the review step. Two questions out of forty went wrong on our own side of this test. The point of citations down to the line is that a reviewer checks the two that matter instead of re-deriving all forty.
06 / Method
How the test was built, and where it flatters us
Forty questions over synthetic private markets disclosure documents, graded in four tiers, run at 10, 100 and 1,000 documents across two independently generated document sets, 4 to 8 repeats per configuration. Grading runs twice: an LLM judge scores each answer and a deterministic string grader runs alongside as a diagnostic.
The vector search arm is not a strawman. It is the production retrieval stack a customer uses: documents chunked, embedded and filterable by filename and folder, behind the same search tool the product ships. It also had keyword search, and it could open whole documents instead of chunks. It used all three heavily, averaging 16.7 tool calls per question against the graph's 6.0. More attempts, more surfaces, 25 points behind. If you want the mechanics of the baseline, our explainer on what RAG is covers them.
Four things cut in our favour, and they should be read before the numbers are quoted anywhere.
The documents are synthetic and generated for this test, which is what makes it possible to grade forty questions objectively across a thousand documents and several thousand runs. It also means they are cleaner than a real data room: no scans, no inconsistent reporting formats.
The corpus and the ontology were built alongside each other, so the graph models everything the questions ask about. Every question is answerable from the graph alone.
So the combination arm was never really tested as a combination. Search fired on 1.4% of its questions. A separate off-ontology set exists, asking for things the graph deliberately does not hold, such as a reference code printed on one reporting pack. Those ten questions have not been run. We expect the graph alone to lose that one.
And at 100 documents both graph arms dip to 92.5%, below their own scores at 10 and at 1,000. Two questions cause almost all of it, both asking how many of a fund's holdings it owns outright. It is not a scaling effect, since both recover at 1,000 on the same corpus family. It is worth about one and a half questions out of forty, and it is on the fix list.
07 / The decision
What to take into a vendor conversation
The uncomfortable part of this result is not that vector search scored 72.1%. It is that on ten documents it scored 83.7%, which is close enough to acceptable that a pilot passes and nobody looks again. The architecture gets chosen on the smallest corpus a firm will ever have, and then the corpus grows every quarter for a decade while the choice stays fixed.
So the question worth taking into a vendor conversation is not which retrieval method is more accurate. It is: at what corpus size were these numbers measured, and what happens to them at a hundred times that. A vendor who has run that test will tell you.
None of this makes vector search useless. It lost the questions it was never built for and held its own on the ones it was. A graph changes which questions reach it. Instead of searching a thousand documents, it reads the three the graph already named. Both configurations that included a graph cost the same and ran at the same speed, so keeping both is not a trade.
You can approximate this test cheaply. Take ten questions your team actually asks, the ones that require finding a set and reducing over it, and run them twice against your production system on the full corpus rather than a sample. Compare the two answers to each other before comparing either to the truth. Consistency fails before accuracy does, and it fails quietly.
We run that exercise with firms on their own documents. It takes about as long as a partner meeting. The rest of what we build for investment teams is on our AI for private markets page.
See it answer your hardest questions on your own documents
Give your firm a memory that does not leave when an analyst does