
Most AI-generated presentations look like they were made by AI. You can tell immediately: the gradients, the stock photos, the layouts that feel generic because they are. Today, we’re sharing what we built instead: an AI presentation maker tool that won’t make your colleagues, clients, or shareholders cringe.
The architecture behind V7 Go Slides
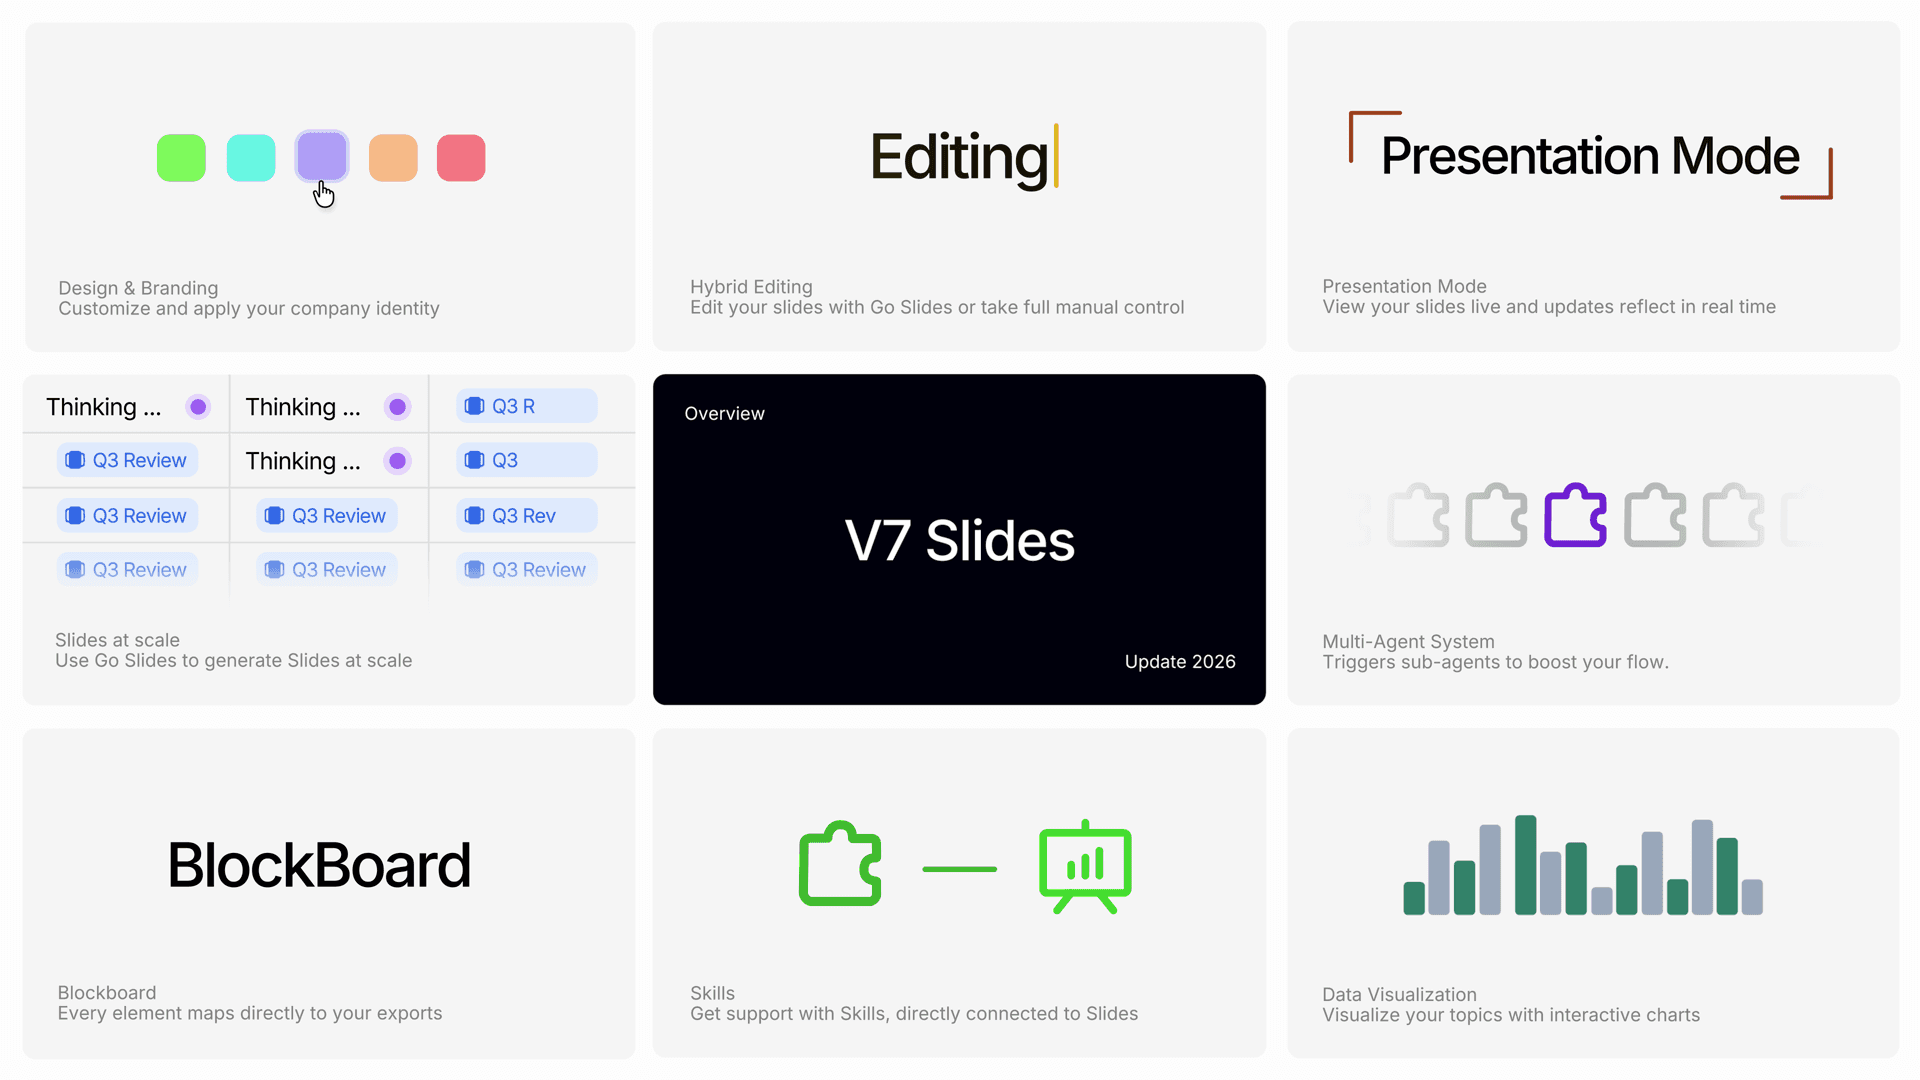
We built V7 Go Slides with five goals: beautiful slides that follow your brand; layouts that work for dense documents and spoken presentations alike; content grounded in real research; charts and visuals that stay editable; and full compatibility with PowerPoint and Google Slides. Today it's live for every user.
The core of V7 Go Slides is a system we call BlockBoard. Every element maps one-to-one with what you'd find natively in PowerPoint or Google Slides: shapes, connectors, text boxes, charts. Not an HTML file doing its best impression of a presentation. Actual slide objects, with connectors that route intelligently between nodes
The one-to-one mapping means nothing is lost on export. Tables stay tables. Charts stay editable charts. A complex information memorandum (dozens of slides, merged cells, financial figures) comes through intact. The same works going the other way: upload your existing PowerPoint template, ask V7 Go to rewrite it for a new company, and the layout and branding stay exactly as they were.
More like a team than a tool
Most slide generators make you do everything sequentially: research first, then write, then design, then find assets, then proofread. V7 Go Slides works more like having a group of specialists you can hand work to at the same time.
Ask it to build a briefing on a fund's portfolio and one agent runs the research, reading through disclosures, filings, and company pages to gather actual source material. Another handles visuals: for complex infographics that go beyond simple diagrams, V7 Go runs the image generation skill with a structured prompt built from the slide's actual content, not a vague description handed to a generator. If you need a logo wall with 30 companies, sub-agents retrieve each one simultaneously, find the correct SVGs, and place them in the layout. By the time you're reviewing the first draft, the assets are already there.
When you're ready to send, a proofreading agent can cross-references every figure in the deck against your internal documents or the web, flags anything that has changed, and cites the updated source. The quality-control pass that normally costs an analyst an hour happens while you move on to something else.
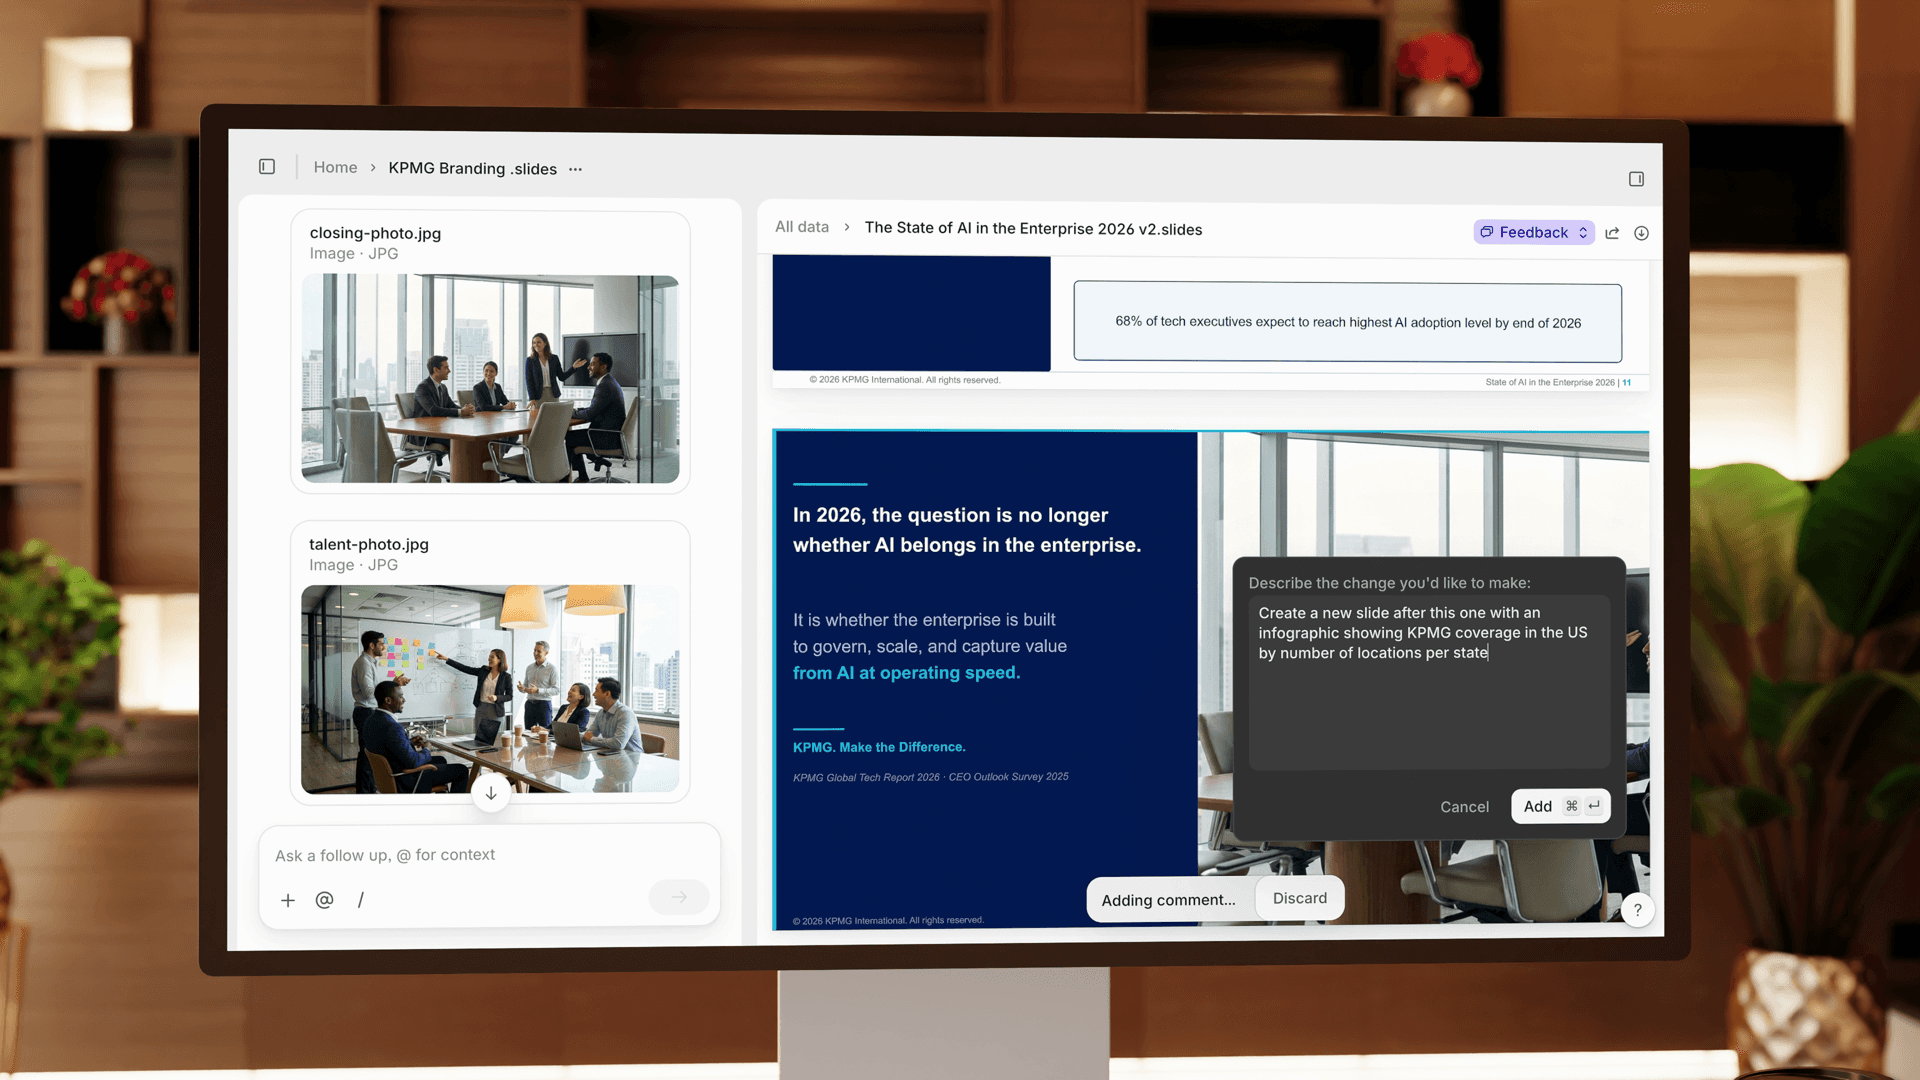
Editing sits on top of all of this and works both ways. Describe a change in plain language ("update this chart to Q3," "move the exec summary to slide two") or drag, resize, and reformat directly. Charts stay editable throughout and export as real chart objects, not images. Complex types like candlestick or waterfall that would normally take an hour to configure take seconds to generate.
The result is less a tool you operate and more a room of people working on the same presentation as you, each handling the part they're best at.
The presentation is where the work lands
Private markets teams on V7 Go process CIMs, complete DDQs, monitor portfolios, and extract financials from datarooms. At the end of every one of those workflows, someone walks into a room to present the findings.
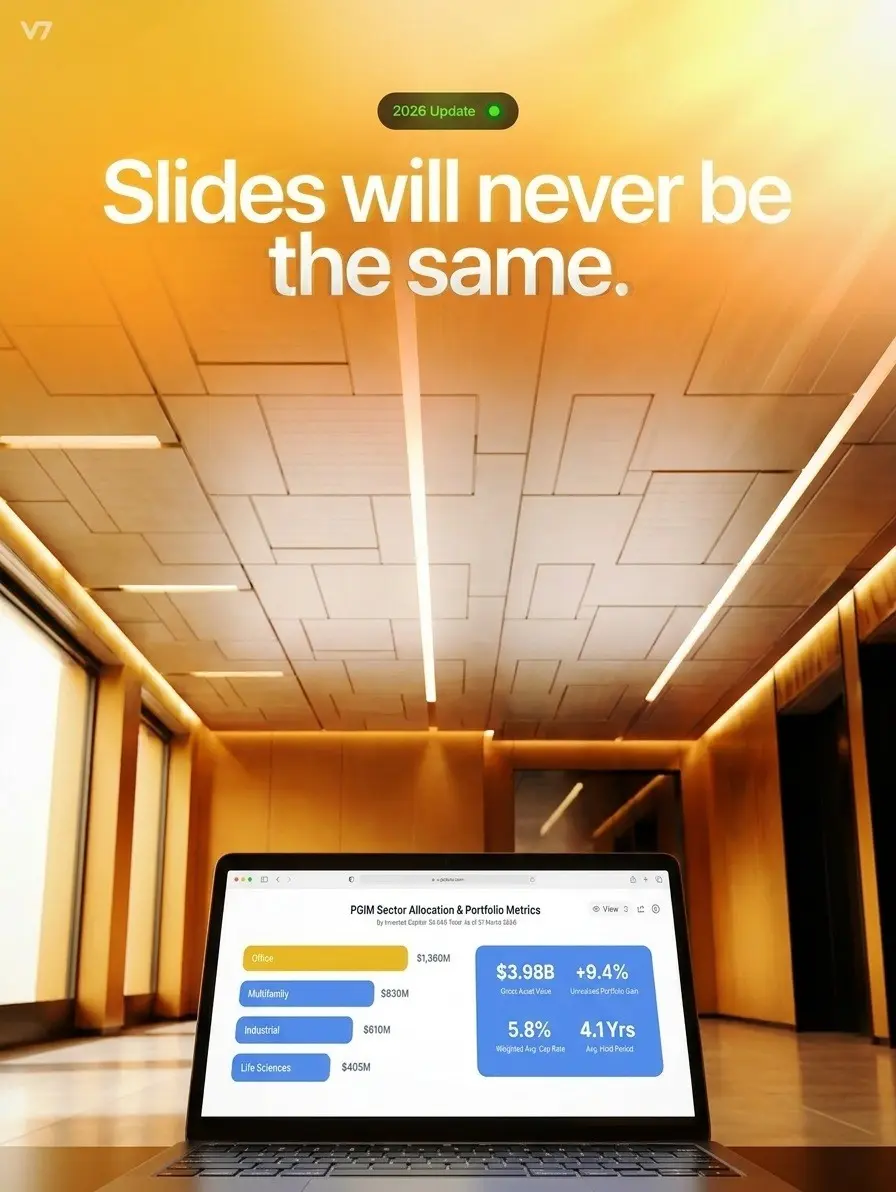
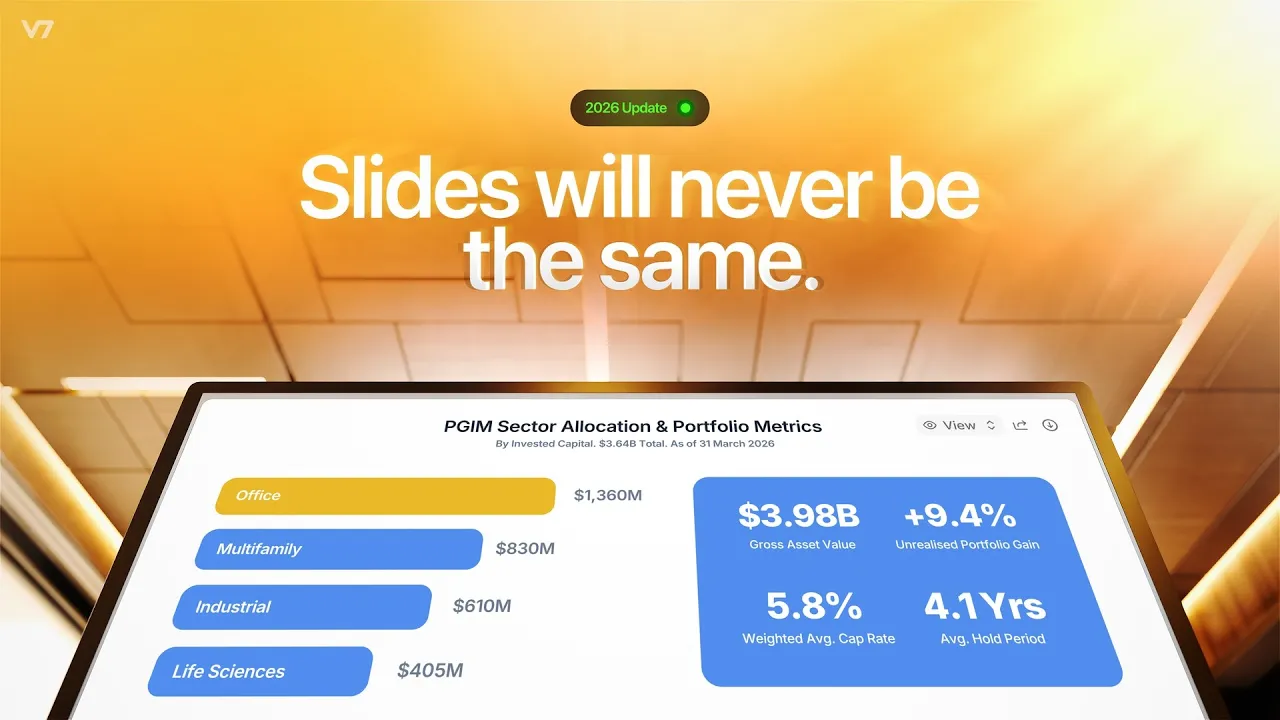
A CIM analysis ends in an IC-ready investment memo deck, with every figure cited back to the source. A dataroom review across hundreds of documents ends in a structured presentation with financial extractions already in the charts. A portfolio monitoring run across 30 quarterly reports ends in an LP reporting deck with KPIs extracted and commentary drafted.
If you're already on V7 Go, open Slides and start with whatever's on your desk. If you're not, book a demo to see the full workflow in action.