Knowledge work automation
15 min read
—


A practical guide on how to analyze income statements and balance sheets with AI, moving beyond manual drudgery to strategic financial insight.

It's a Thursday afternoon (or worse, evening) scene depressingly familiar to financial analysts everywhere. A senior analyst at a mid-size investment firm leans closer to her screen, eyes dry from hours of copy-pasting quarterly earnings from a dense PDF into an Excel spreadsheet. The deadline is approaching, and real analysis is still waiting behind a wall of repetitive data entry.
It’s no wonder nearly 40% of CFOs don’t fully trust the accuracy of their own financial data, citing issues like data spread across too many sources and outdated manual processes. More troubling still, modern finance teams spend only about 25% of their time on actual analysis, with the rest lost to gathering data and administrative processes.
While analysts remain buried in spreadsheets, AI systems are increasingly capable of processing financial documents with exceptional accuracy. By automating the manual aspects of financial analysis, AI creates space for the strategic thinking, pattern recognition, and business judgment that define exceptional financial professionals.
In this guide, we'll first recap the fundamentals of how to read an income statement and balance sheet. Then, we will explore how AI is not just speeding up this process but fundamentally improving it, turning static reports into dynamic, verifiable insights.
The foundational documents of financial analysis: income statements and balance sheets
How agentic AI transforms the inefficiencies of manual analysis
Practical steps for automating financial statement reviews with platforms like V7 Go
The future role of the financial analyst in an AI-augmented world

AI for document processing
Let AI agents analyze financials so your team doesn't have to
Get started today
Decoding Financial Health: The Income Statement and Balance Sheet
Before exploring how artificial intelligence can enhance financial analysis, it's essential to have a solid grasp of the foundational documents themselves, and how they have typically been used and processed by financial analysts.
Understanding the Income Statement
An income statement, also known as a profit and loss (P&L) statement, summarizes a company's revenues, expenses, and profits over a specific period, like a quarter or a year. It's a narrative of the business's operating performance, revealing whether the company made or lost money during that time frame.
Reading an income statement effectively involves breaking down each line item and understanding its contribution to the overall story.
Revenues (or Sales): This is the top line, the total money earned from selling goods or services. Strong revenue growth signals market demand or successful expansion. An analyst will often dig deeper here, disaggregating revenue by product line, geography, or customer segment to understand what truly drives the company's sales.
Cost of Goods Sold (COGS): These are the direct costs tied to production, such as raw materials and direct labor. Subtracting COGS from revenue gives you gross profit. The gross profit margin (gross profit divided by revenue) is a key measure of production efficiency and pricing power. A declining gross margin could indicate rising input costs or increased competitive pressure.
Operating Expenses: These are the indirect costs of running the business, like selling, general, and administrative (SG&A) expenses, and research & development (R&D). Subtracting these from gross profit yields operating income (or operating profit), a crucial subtotal often called EBIT (Earnings Before Interest and Taxes). This figure reflects the profitability of the company's core operations.
Interest and Other Non-Operating Items: Below operating income, companies report any non-operational gains or losses, such as interest expense on debt or gains from asset sales. It's important to note if a large portion of profit is coming from these non-core, potentially one-time items.
Net Income: After accounting for taxes, you arrive at the bottom line. Net income is the ultimate profit for the period attributable to shareholders. Consistent net income growth is a hallmark of a healthy, growing company, but an analyst will always probe the quality of those earnings.
By performing a vertical analysis (expressing each expense as a percentage of revenue) or a horizontal analysis (comparing line items over time), analysts can spot trends and anomalies.
For instance, a vertical analysis might reveal that marketing expenses have grown from 10% to 15% of revenue, prompting questions about the ROI of that spending and its impact on the net profit margin.
Understanding the Balance Sheet
If the income statement is a movie of performance over time, the balance sheet is a snapshot of what a company owns and owes at a single point in time. It is structured around the fundamental accounting equation: Assets = Liabilities + Shareholders' Equity.
This equation must always hold true; it shows that everything the company has (assets) was financed either by borrowing (liabilities) or by investments from owners plus accumulated profits (equity).
Assets: These are the resources the company controls that have economic value. They are categorized into current assets (like cash and inventory, expected to be converted to cash within a year) and non-current assets (like property, plant, and equipment (PP&E) and intangible assets like patents).
Liabilities: These are the company's obligations. They are also split into current liabilities (due within one year, like accounts payable and short-term debt) and long-term liabilities (like bonds and long-term loans).
Shareholders' Equity: This is the residual interest in the assets after deducting liabilities, often called the “book value” of the company. It represents the capital invested by shareholders plus all the net income the company has retained over time.
The balance sheet reveals a company's financial resilience. Ratios like the current ratio (current assets / current liabilities) assess short-term liquidity. A ratio below 1.0 could signal trouble paying bills. The debt-to-equity ratio gauges long-term solvency and financial risk.
When read together, the two statements provide a powerful narrative. For instance, rising revenue from the income statement, fueled by a massive increase in debt on the balance sheet, might signal unsustainable growth. This insight only emerges by connecting the two.


Why Manual Analysis Falls Short: Inefficiencies and Risks
The traditional process of manual analysis is riddled with inefficiencies that can compromise decision-making. These challenges represent a fundamental drag on the strategic capacity of any finance function.
The cumulative effect is an organization that is less accurate, less efficient, and less agile than it needs to be in a competitive environment.
Almost two-thirds (64%) of respondents [CFOs] said the overwhelming volume of manual work leaves little or no time for financial planning and analysis, and more than two-thirds (68%) said that manual work leaves their organization vulnerable to errors that could undermine business decision-making.
Notoriously error-prone
The simple act of transferring numbers from a PDF into a spreadsheet is a minefield for mistakes. A misplaced decimal, a dropped negative sign, or an incorrect cell reference can cascade through an entire financial model and lead to materially flawed conclusions.
One global survey found nearly 70% of finance professionals admitted the volume of manual work leaves their organization exposed to mistakes that could impact business decisions
On a smaller scale, companies frequently find and correct reporting errors only after they've been circulated. Over time, this can chip away at trust in the finance team's numbers.
The Cost of Inaccuracy: A JP Morgan Case Study
In 2012, one particularly infamous $6 billion loss at JPMorgan was (naturally, only partially) attributed to a simple spreadsheet copy-paste error.
JPMorgan’s London-based Chief Investment Office, overseen by Ina Drew, was pursuing a complex trading strategy using credit derivatives as part of a synthetic credit portfolio. One trader, Bruno Iksil, built positions so large that markets dubbed him the “London Whale.”
The bank relied on a model maintained in Excel spreadsheets and updated by hand to monitor risk. Key data was copied across multiple sheets with intricate formulas, an environment ripe for mistakes.
A critical formula error crept in: a calculation meant to average hazard rates (a measure of default probability) instead divided by their sum. A small difference mathematically, but enough to understate volatility by a meaningful amount.
The portfolio’s exposure ballooned. Losses mounted while risk limits were breached hundreds of times. Some warning signs were masked by aggregated reports, and internal reviews were delayed or incomplete. Controls failed to catch the miscalculations until it was too late.
By the time the error was discovered and the positions unwound, JPMorgan had amassed a trading loss of approximately $6–6.2 billion. The fallout was severe: investigations, regulatory penalties, resignations, and a serious reputational hit.

JP Morgan share price in American dollars, from the Financial Times
Delayed insights
At each quarter-end, finance teams may spend days or even weeks consolidating statements and preparing presentations. By the time management or investors see the analysis, the information can be effectively outdated.
This lag creates a huge opportunity cost. If an analyst wants to explore a new question, such as a segment's profitability excluding a one-time charge, getting the answer can require hours of digging and recalculation. In dynamic markets, this lack of real-time analysis means a business might fail to react to emerging threats or opportunities because its insights trail reality.
This manual grind also represents an inefficient use of talent. Highly trained and well-compensated finance professionals often spend a disproportionate amount of their time on low-value tasks. It’s no wonder that a lack of automation is cited as a primary roadblock to an efficient financial close process
Scalability and data silo issues
As organizations grow, the volume and complexity of their financial data explode. An approach that works for a startup becomes unmanageable for a multinational with multiple divisions.
Furthermore, financial data often resides in different systems—ERP, CRM, departmental reports—and manual analysis struggles to bring it all together.
This lack of integration forces analysts to spend valuable time reconciling numbers instead of understanding them, creating a significant risk for businesses that need to scale their analytics capabilities to compete effectively.
How AI Transforms Financial Statement Analysis
Modern AI systems can read income statements and balance sheets with exceptional accuracy, extracting data from financial documents without the need for endless copy-paste cycles. By automating and enhancing each stage of the analytical workflow, AI enables finance professionals to operate with a speed, depth, and accuracy that was previously unattainable.

AI-powered workflows automate financial statement analysis, from data extraction and ratio calculation to anomaly detection, allowing analysts to focus on strategic insights.
Automated Data Ingestion and Source-Linked Extraction
One of the most immediate and impactful benefits of AI is its ability to automatically read and process financial documents. Modern document processing platforms can ingest an entire year's worth of financial statements, whether they are PDFs, scanned images, or Excel files, and extract all the relevant numbers into a structured format within seconds.
This process is powered by a combination of advanced Optical Character Recognition (OCR) and Natural Language Processing (NLP) that can understand financial context. For example, it can distinguish between different types of revenue, identify non-recurring items in the footnotes, and correctly interpret complex table layouts that would confuse generic OCR tools.
According to Payables Place, companies that automate invoice processing have an 80% lower invoice processing cost than those who don't, primarily thanks to the significant time savings.

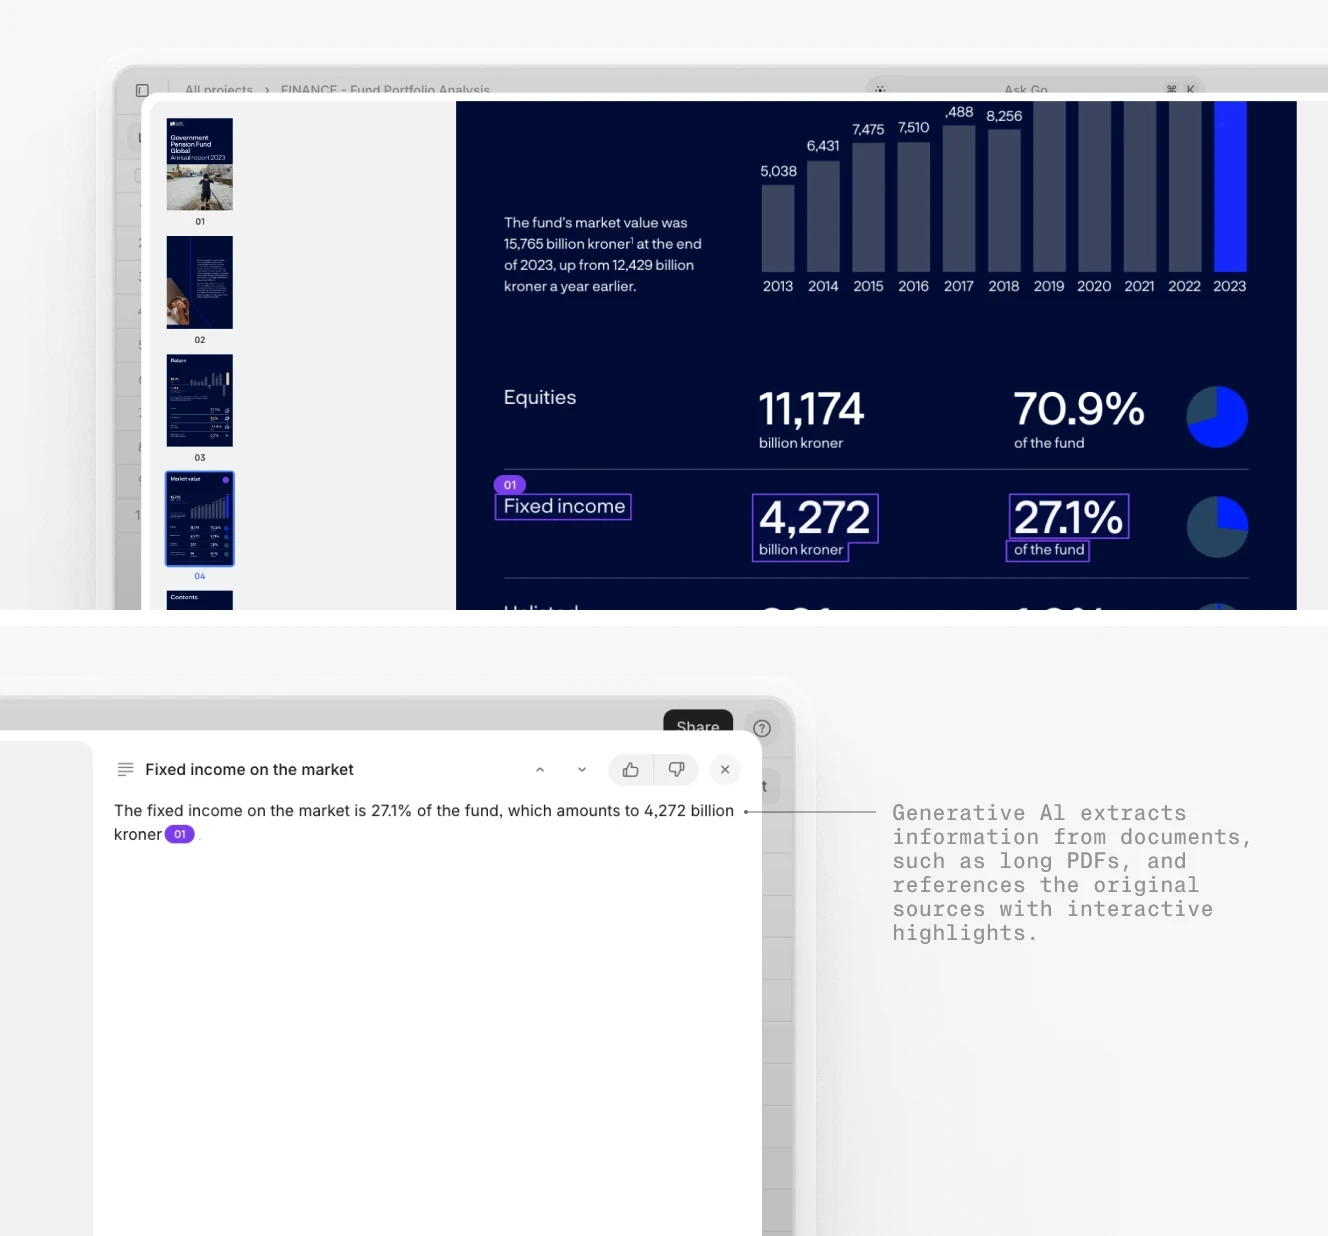
Crucially, leading AI platforms like V7 Go provide source-linked traceability. This feature, sometimes called AI Citations or visual grounding, links every extracted data point directly back to its precise location in the original document.
If the AI reports a specific figure for net income, or a particular business address, a user can click on that information and instantly see it highlighted within the source.
See an example below in V7 Go.

This transparency is vital to build trust in AI-generated data. It preserves the audit trail and allows finance teams and auditors to embrace AI's efficiency, without sacrificing the rigor of verifiability.
Automated Ratio Analysis and Anomaly Detection
AI can actively analyze the numbers it extracts. As soon as the structured data is available, the system can be configured to automatically calculate a comprehensive suite of financial ratios for every period and every business unit. This includes everything from liquidity ratios like the current ratio to profitability metrics like return on equity. The platform can generate time-series data for these metrics, allowing for trend analysis and data visualizations.
More impressively, AI can apply machine learning techniques to detect anomalies or patterns that a human might miss. For instance, it could perform a horizontal analysis on every line item and automatically flag that “Operating expenses grew by 30% quarter-over-quarter, which is 2.5 standard deviations above the historical trend.” Or it might perform a vertical analysis and highlight that a company’s R&D spending as a percentage of revenue has been steadily declining.
This intelligent analysis acts as a diligent co-pilot, ensuring that subtle red flags or emerging trends are surfaced for human review.

Intelligent Summarization and Conversational Q&A
Beyond the numbers, generative AI excels at understanding and summarizing narrative content. An AI agent can read the lengthy Management’s Discussion and Analysis (MD&A) section of a 10-K and produce a concise summary of the key themes, such as management’s explanation for a drop in gross margin.
For instance, it might report: “Management attributes the margin decline to rising raw material costs and increased shipping fees, and anticipates these pressures will continue into the next quarter.”
This capability is taken a step further with interactive, conversational Q&A. Finance professionals can now engage in a dialogue with their financial data.

An analyst using a platform like V7 Go’s AI Concierge could ask, “What were the main drivers of the change in working capital this quarter?” The AI would consult the relevant statements and provide a direct answer, complete with citations.
This conversational approach makes complex financial data accessible to a broader range of stakeholders and enables a more dynamic, iterative analysis process.
Agentic Analysis and Multi-Step Workflows
The most advanced application of AI in this domain is through agentic AI. This refers to AI systems that can autonomously execute multi-step analytical tasks using a variety of tools. Instead of responding to a single prompt, an AI agent can be given a high-level objective and orchestrate a complete workflow to achieve it.
AI agents will become the primary way we interact with computers in the future. They will be able to understand our needs and preferences, and proactively help us with tasks and decision-making.
— Satya Nadella, CEO of Microsoft
For example, an analyst could instruct an AI agent: “For the five companies in our peer group, pull their latest 10-Q reports, extract their income statements, calculate their operating margins, and generate a comparative chart. Also, summarize the key points from each company’s MD&A regarding their outlook for the next quarter.”
The AI agent would then use various tools—a web search tool to find the reports, a document processing tool for extraction, a calculation engine for the ratios, and a generative model for the summary—to complete the entire assignment.
Explore the V7 Go Agent Library.
AI in Action: The V7 Go Platform for Financial Analysis
V7 Go is purpose-built to automate complex document workflows for finance and accounting. It can serve as an “AI intake analyst,” ingesting large volumes of documents—quarterly reports, auditor statements, bank PDFs—and intelligently cataloging them.
This creates a well-structured repository of financial data ready for analysis, ending the chaos of hunting through email threads for the right files.
The V7 Go platform allows users to upload financial statements and use AI to extract, analyze, and verify data, with every insight linked back to its source.
Once ingested, V7 Go’s AI parses the documents to extract key financial data with a high degree of precision. Each extracted figure is linked to its specific source location in the document via its AI Citations feature.
One consulting firm leveraging V7 Go reported a 35% productivity increase in the first month, largely due to the reduction in manual data preparation and validation.
We looked and tried many different AI products, including building our own. The key differentiator with V7 is its ability to understand complex documents with detailed charts and tables. We have seen nothing that compares to the accuracy we get with using V7. When you add this to all of the other features of V7 like multiple models and components, this makes the product invaluable to our team.
— Trey Heath, CEO, Centerline
V7 Go's AI Concierge feature brings conversational Q&A to life.
Users can drill down with follow-up questions, turning static analysis into a dynamic, iterative exploration of the data.
The Future of Financial Analysis
With AI handling the mechanical work, analysts are freed to focus on activities that demand nuanced human judgment. This includes interpreting the “why” behind the numbers AI presents, understanding the broader business and competitive context, and crafting strategic narratives from analytical findings.
When analysts can process financial statements 21x faster, as some V7 Go users have experienced, they can analyze more companies, explore more complex scenarios, and ultimately provide deeper, more valuable insights.
The opportunity to remove manual and inefficient processes from the financial close process is becoming a reality for more and more CFOs and controllers as they see the return on investment, and improve accuracy and efficiency.
— Omar Choucair, CFO of Trintech, in CFO Dive
The skillset for financial professionals is also shifting. Proficiency in Excel remains important, but an understanding of how to work with AI—how to frame effective questions, validate AI-generated outputs, and integrate AI insights with qualitative judgment—is becoming increasingly critical. Business context and industry expertise become even more valuable, as these are the filters through which AI-generated data must be passed to become true business intelligence.
The future belongs to hybrid professionals who can seamlessly blend their own analytical skills with the computational power of AI. For more on this, our guide on whether AI will replace financial analysts offers deeper context.
The transformation of financial statement analysis is already underway. For organizations willing to embrace these new technologies, the payoff is a finance function that is more efficient, more accurate, and more agile.
To learn more about how AI could streamline and enhance your workflows, talk to our team.

What is the main difference between an income statement and a balance sheet?
An income statement reports a company's financial performance, showing revenues, expenses, and profits over a specific period, like a quarter or a year. It tells a story of operational performance. A balance sheet, in contrast, provides a snapshot of a company's financial position at a single point in time, detailing its assets, liabilities, and shareholders' equity. Think of the income statement as a movie and the balance sheet as a photograph.
+
How does AI improve the accuracy of financial statement analysis?
AI improves accuracy in several key ways. First, it automates data extraction from documents, which drastically reduces the human transcription errors that are common in manual processes. Second, advanced platforms like V7 Go provide source-linked traceability through features like AI Citations, allowing every extracted figure to be verified against the original document. Finally, AI can perform automated validation checks, such as ensuring a balance sheet actually balances or flagging inconsistencies between different financial reports, catching errors that a human might overlook.
+
Can AI truly understand the context of financial documents, like footnotes?
Yes, modern AI, particularly systems using large language models (LLMs) and computer vision, can understand the context within complex financial documents. They are trained to recognize the structure of financial tables and identify what specific line items refer to. More importantly, they can extract critical information from dense narrative sections like footnotes or the Management’s Discussion and Analysis (MD&A). For example, an AI can identify a contingent liability mentioned in a footnote and understand its potential impact on the balance sheet, providing a more complete analytical picture.
+
Will AI replace financial analysts?
No, AI is more likely to augment the role of financial analysts, not replace them. AI excels at automating time-consuming and repetitive tasks like data gathering, extraction, and routine calculations. This frees up human analysts to focus on higher-value activities that require critical thinking, strategic interpretation, client communication, and nuanced professional judgment. The analyst's role will shift from being a data processor to a data interpreter and strategist, leveraging AI as a powerful assistant.
+
What is agentic AI and how does it apply to financial analysis?
A practical and effective approach is to start with a focused, high-impact pilot project. Identify a specific, repetitive, and time-consuming pain point in your current workflow, such as processing quarterly earnings reports for a key set of peer companies. Use a platform like V7 Go to build a simple workflow to automate this specific task. This allows your team to demonstrate clear and measurable ROI, build internal confidence, and learn best practices before scaling the AI implementation to more complex analyses or other parts of the finance function.
+
How can a business start implementing AI for financial statement analysis?
Go is more accurate and robust than calling a model provider directly. By breaking down complex tasks into reasoning steps with Index Knowledge, Go enables LLMs to query your data more accurately than an out of the box API call. Combining this with conditional logic, which can route high sensitivity data to a human review, Go builds robustness into your AI powered workflows.
+
Imogen is an experienced content writer and marketer, specializing in B2B SaaS. She particularly enjoys writing about the impact of technology on sectors like law, finance, and insurance.

